Let me show you two charts explaining why I believe the S&P 500 is in a heap of trouble.
First, you have to understand that the Fed changed the game when it raised its benchmark interest rate on December 16.
That was the first interest rate hike we’d seen in nearly 10 years - since June 2006. Back then, the economy was hot: unemployment was at 4.4% and the housing bubble had yet to burst. It made sense for the Fed to raise rates.
This time, the Fed hiked rates for different reasons: not because the economy is hot, but because it wants to give itself some room to maneuver if the economy starts to cool down.
Fair enough. The economy can adjust to higher interest rates. But the market may be a different story.
Let me remind you that rates have been near zero since December 2008. The Fed also spent more than four years pumping money into the market through variations on its quantitative easing program.
We’re talking trillions and trillions of dollars of stimulus.
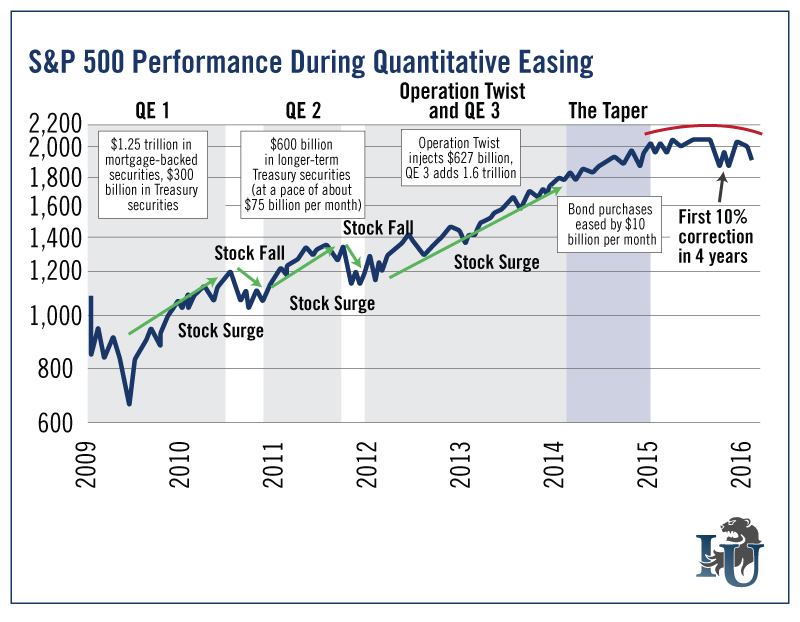
Did that make a difference? Look at this chart and you tell me...

As you can see, the stock market rose every time a quantitative easing program was in place. Then it crumbled every time the Fed eased back on the joy juice. That, in turn, triggered another round of easy money.
Here’s how quantitative easing (QE) works...
The Fed creates money by buying securities - such as government bonds - from banks with electronic cash that did not exist before. The new money swells the size of bank reserves by the quantity of assets purchased (hence "quantitative" easing).
The Fed did QE1, QE2, Operation Twist (when it sold short-term Treasury bonds and used the proceeds to buy long-term Treasury bonds, effectively driving down rates for the long-term bonds) and QE3. The goal was to stimulate the economy by encouraging banks to make loans. And maybe it did some of that.
But it also enabled banks to take that new money and buy assets to replace the ones they sold to the central bank. And that includes stocks.
QE created a “wealth effect.” You might also say the Fed front-loaded a stock market rally. Still, it wasn’t the real economic stimulus the Fed was looking for.
In the last phase, the Fed took its foot off the gas pedal ("The Taper"). It eased off bond purchases by $10 billion a month, making its final $15 billion purchase the week of October 29, 2014.
Looking at the chart above, you can see that when the Taper ended, stock prices flattened. Over the course of 2015, the S&P 500 formed what some cheery Wall Street wags call “the Dome of Doom,” which I’ve marked as a red curve.
One more thing about QE...
It certainly pushed up the market's price-to-earnings ratio (P/E). This might have been okay if earnings accelerated and caught up. But earnings growth is stuck in low gear.
And now, the market is at the high end of its normal valuation range.

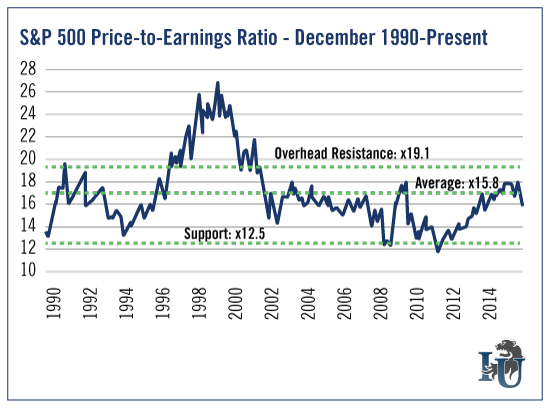
You can see that the S&P 500 closed most recently at a forward P/E near 16. That’s very close to its average since 1990.
If the forward P/E of the S&P 500 got down to 12.5, the S&P 500 might be cheap. But if the forward P/E approached 19.1, it would look pricey to me.
But as I said, earnings growth has slowed to a crawl. Heck, it’s downright negative. For the fourth quarter, total S&P 500 earnings are expected to drop anywhere from 7.3% to 1% compared to the same period a year earlier (how much depends on who is doing the forecasting).
Meanwhile, QE has ended. The Fed isn't there to push the market higher. It might not even be there to keep it at current levels.
This is not a "doom" scenario. But over the long term, it is a signpost for a correction that could last more than a week.
On the bright side, a decent correction might bring us to where there are real bargains - as long as the underlying economy stays healthy, justifying earnings expectations.
The better news is that some companies can grow revenue and earnings, even in this tough environment. I think those are the kinds of opportunities you should seek now.
