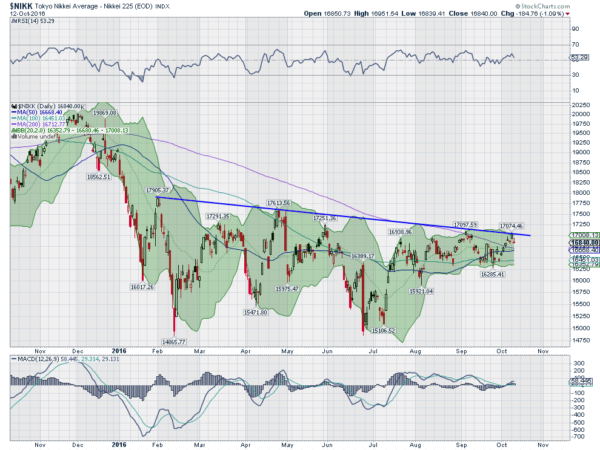
The Japanese stock market has been in the doldrums in 2016 -- at least compared to the US market. While US stocks fell in January and then charged to new all-time highs, Japanese market fell and has just sat there. No energy at all. Making lower highs for a full year, now.
But that may be about to change.
The chart below shows the last 12 month's of price action. Take note first on the far left side where the fall started. The Nikkei was near the 20,000 level -- a nice round number -- and was over its 200-day SMA. It fell quickly to 16,000, a 20% drop, before stagnating over the last 9 months. The series of lower highs has created falling trend resistance.

So what has changed? Last week the index reclaimed its 200-day SMA. A week ago it moved back over that level where it has held. This is at the falling trend resistance as well. The 50-day SMA has now moved up within 50 points of the 200-day SMA, very close to a Golden Cross. It is not signalling "buy" yet, but it's close.
What will it take? A move over that trend resistance and continuation over 17,100 is a good start. It would make for a higher high in the short term. Momentum lifting off of the zero line for the MACD and the mid line for the RSI would add weight to the story. And solid confirmation would come on a move over 17615, the April high. So keep an eye on the Nikkei.
