It's no secret that of the thousands of cryptocurrencies in the world many of them are scams.
One particular scam met a rather gruesome end yesterday amid the panic selling frenzy. To industry insiders, the word Bitconnect is a dirty word. Their entire business model simply looks and smells like a Madoff style pyramid scheme where old investors are paid dividends using the money from the fresh money coming in.
Here we can see the price per BCC token crashing from $478 at the peak of the crypto-craze in December to below $10 last night.
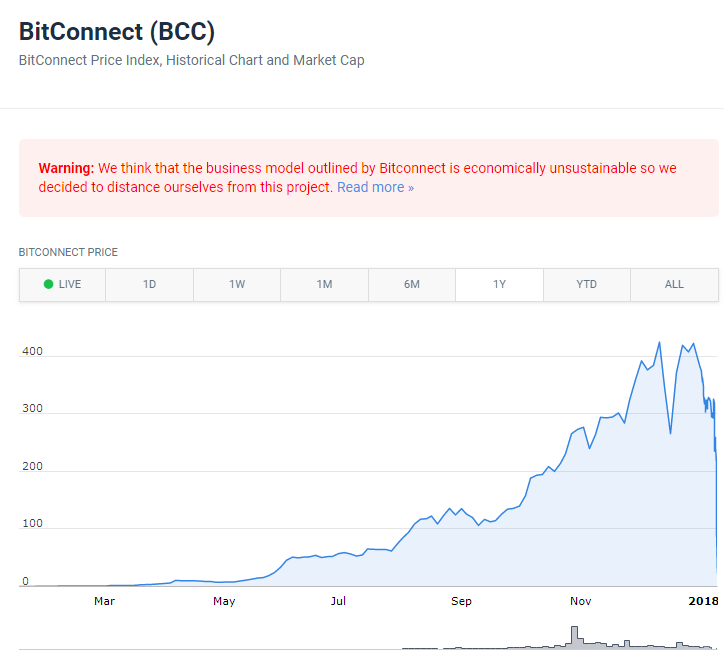
Notice how the website above coincodex.com puts a friendly warning notice in clear view on their website. Not like some other coin price websites that we've written about in previous updates.
Today's Highlights
Government Shutdown
XAU/BTC - Gold Correlation?
Support from Japan
Please note: All data, figures & graphs are valid as of January 17th. All trading carries risk. Only risk capital you can afford to lose.
Traditional Markets
Wall Street did indeed come back from its long weekend in a good mood but things quickly turned sour when investors realized that the US government may just be headed for a good old fashioned shut down by the end of the week.
Here we can see the opening bell for the Dow Jones with a nice gap above 26,000 points, a milestone for this index. The gap was quickly covered on the downside, followed by a ramp up to a new all time high of 26,085 before seeing the worst sell-off so far this year.
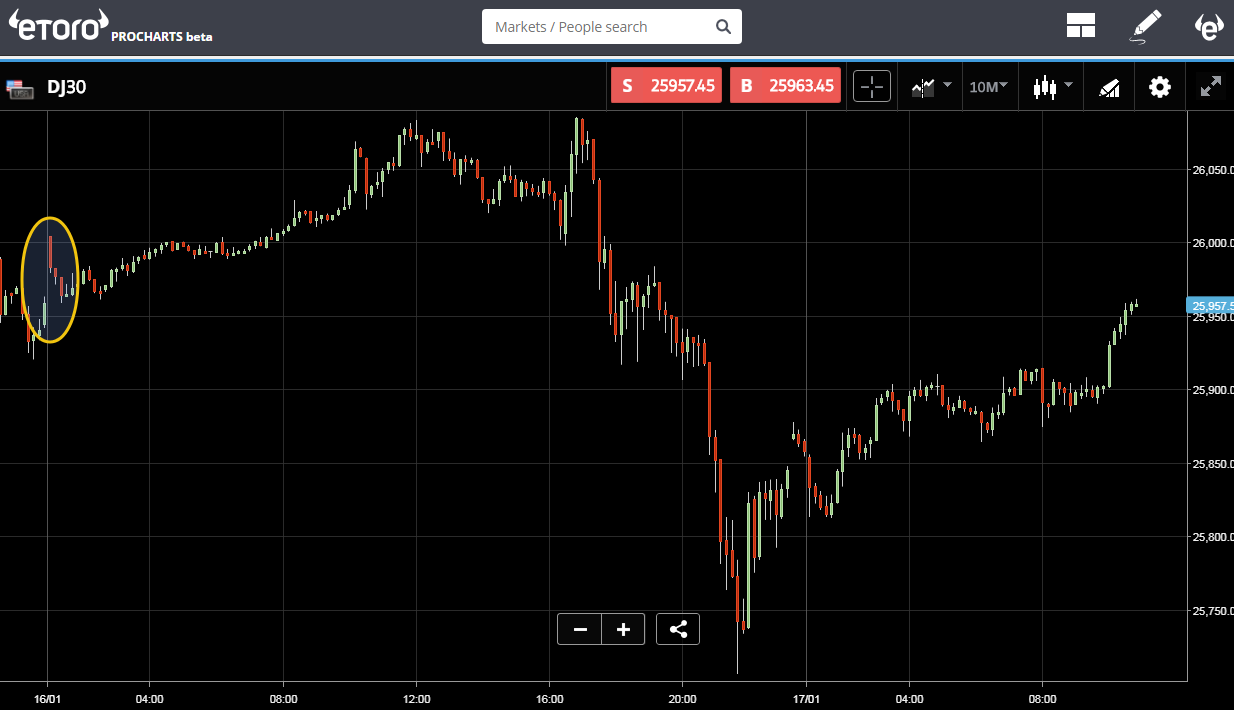
The sell off in stocks is probably not related to the sell off that we saw in cryptocurrencies this week. This drop only brought it down to the levels that were traded in the market last Friday while the crypto market is already back to prices not seen since December.
Gold Correlation??
Whenever there is a strong movement across different assets, it's a great opportunity to compare and contrast. Though I believe that the micro movements in digital currencies are not yet as correlated as stocks, bonds, commodities, and currencies this chart shows a stringing connection.
Here we can see Bitcoin in white, Gold in yellow, and the S&P 500 in blue. Just take a look at the middle of the chart and we can see that indeed Gold and Bitcoin both fell sharply at the beginning of the European session, just before the Asian investors went to bed and way before New Yorkers opened their eyes.
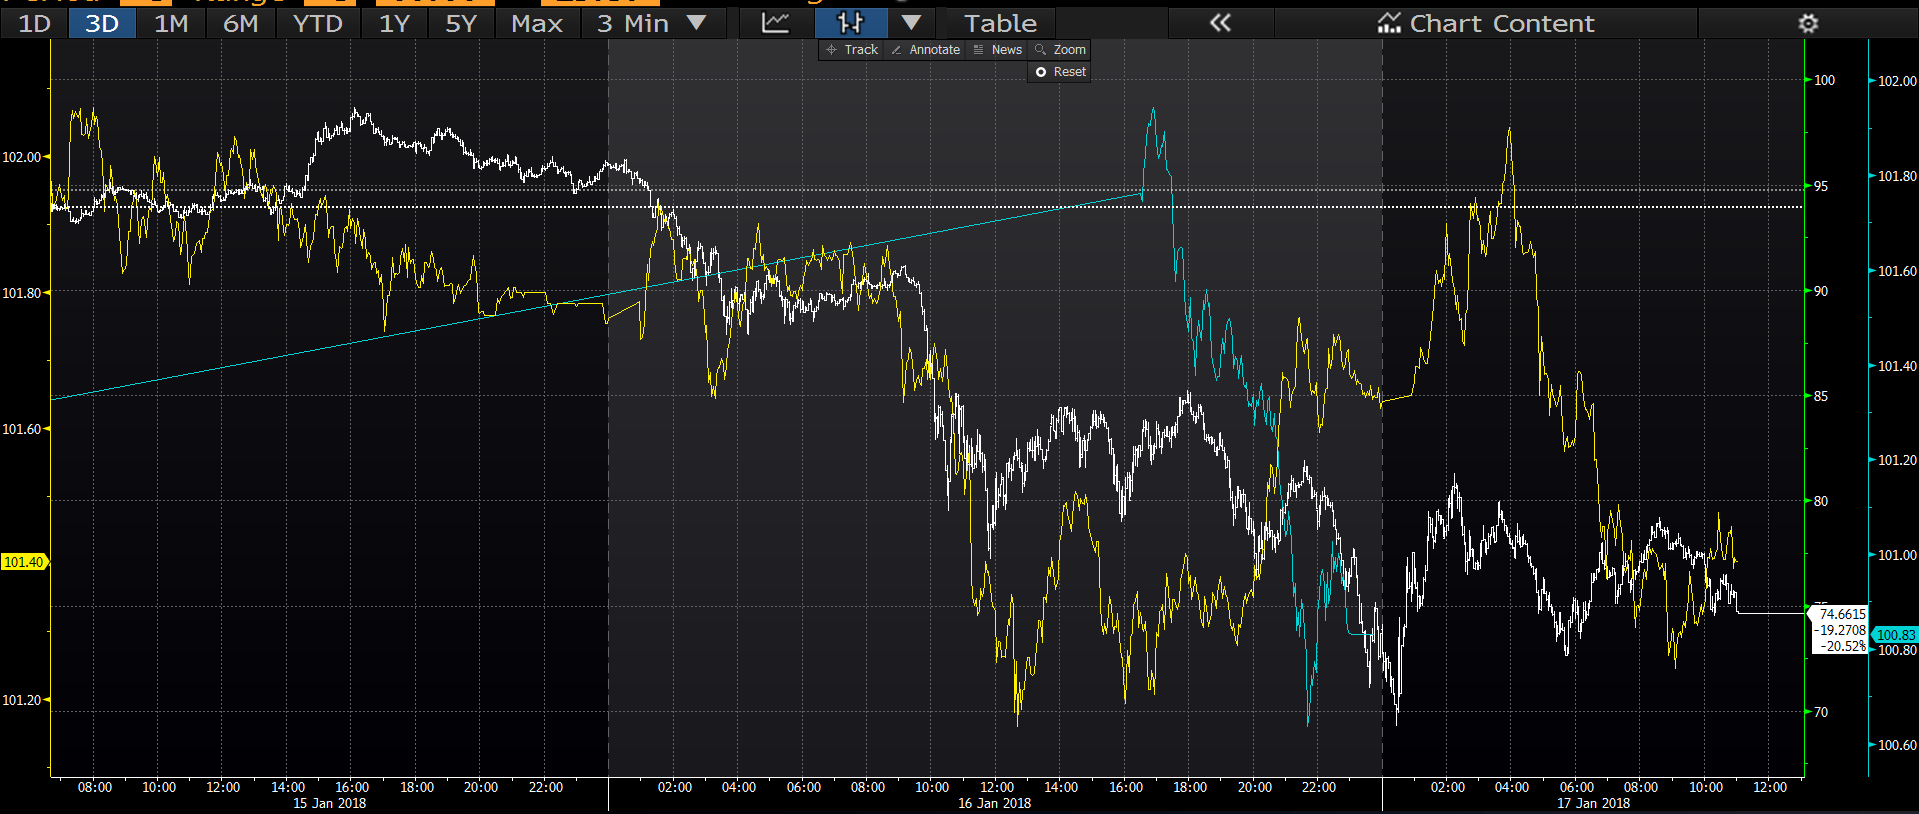
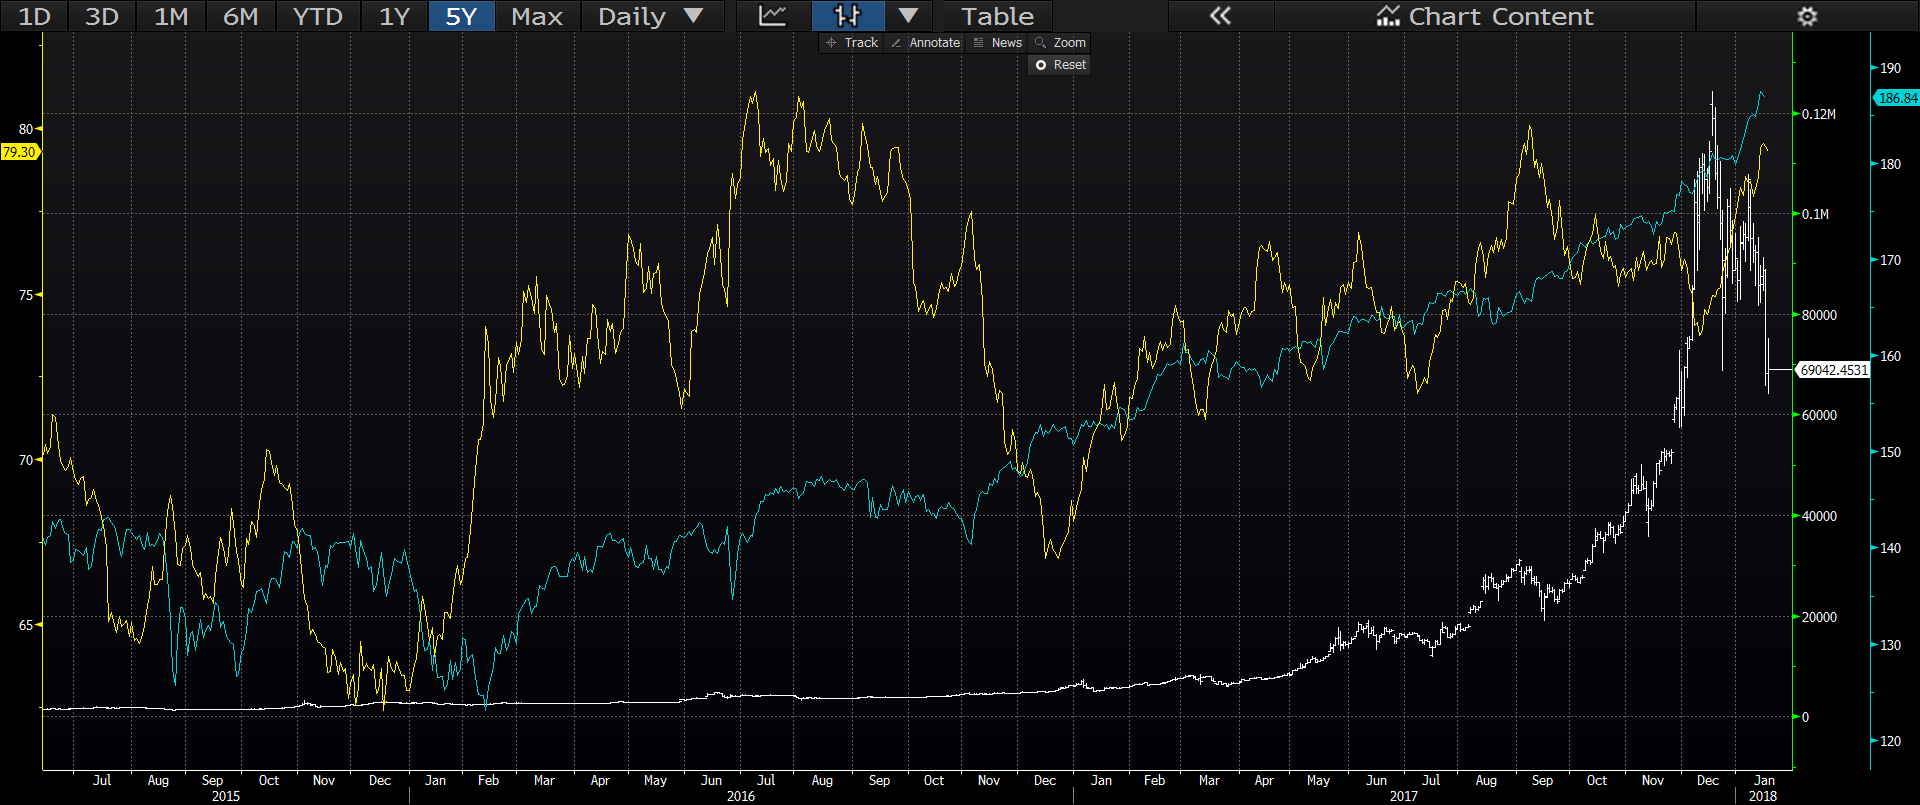
Of course, looking at this timeframe is sort of like looking through a straw. You don't really get the big picture. The same chart over the last 3 years shows all three assets rising fairly steadily, which is most likely explained by the copious amounts of money that's been created by central banks over the last decade.
Ether Support
Those of you who have been reading my updates for a while know that I never presume to know what will happen next in the markets. Rather, I prefer to do my best to explain what is happening at the moment and what are the possibilities.
In Monday's update titled "I have a dream today" I presented the following chart for Ethereum. The purpose was to show that if there is a sell-off, this is where the likely support could come in.
Well, we had the sell-off and as you can see, the support is now
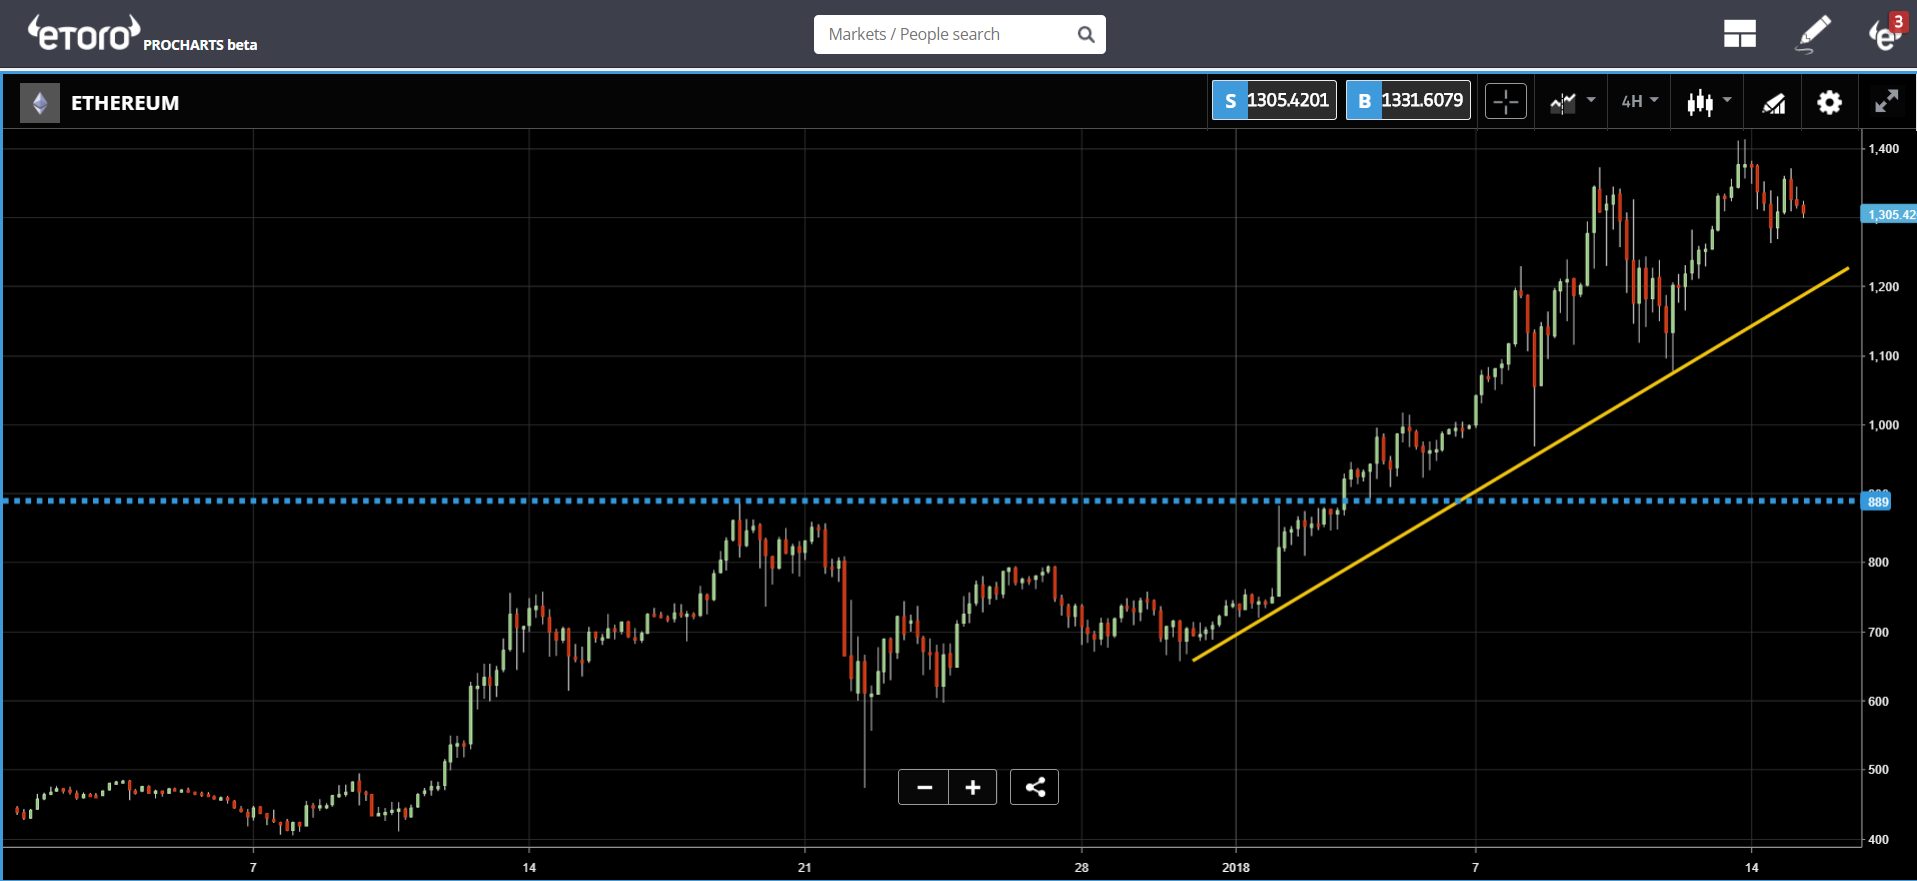
As you can see, we are now at the levels right around that blue line at $889.
I'm reposting this not to toot my own horn but simply to emphasise that this recent "panic" that has grabbed many headlines is nothing out of the ordinary for this industry.
There has been no fundamental shift in regulation or psychology that sparked the selling. it is simply the thin liquidity of this unique and exciting market playing out in real time.
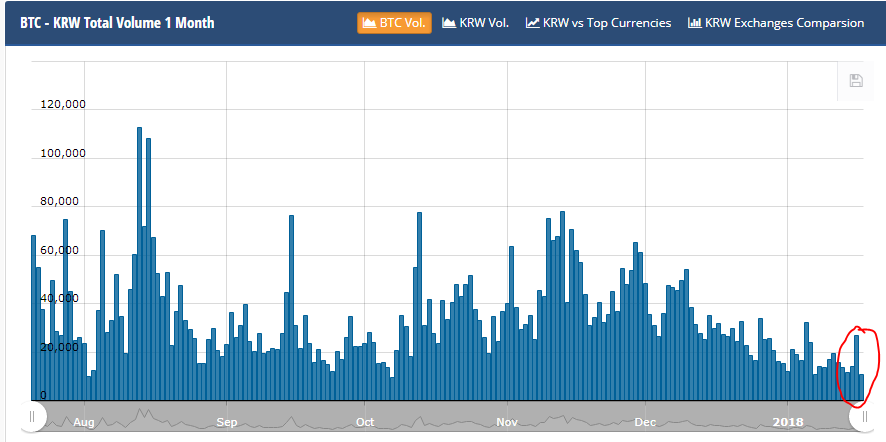
As we noted yesterday, there's been a trend from South Korea and Japan of lower volumes these last few weeks. That did indeed come up a bit yesterday but is still nowhere near what it was in November/December.
Here's Bitcoin's Korean Won volume...
and here's Japanese Yen...
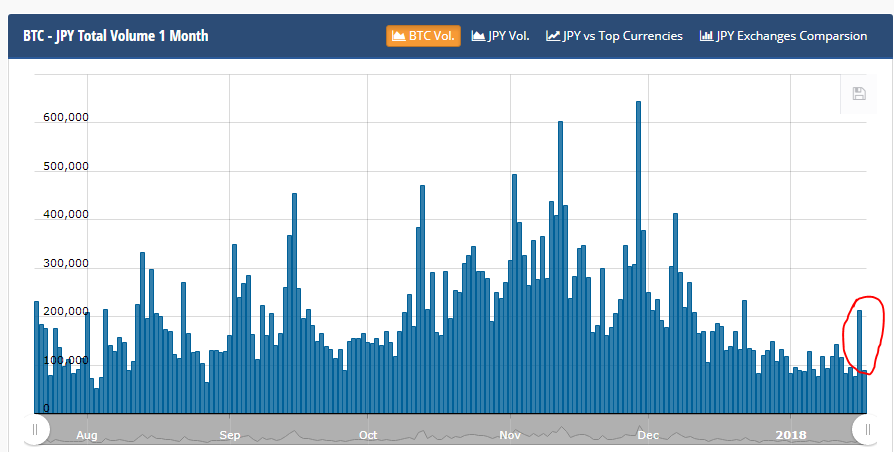
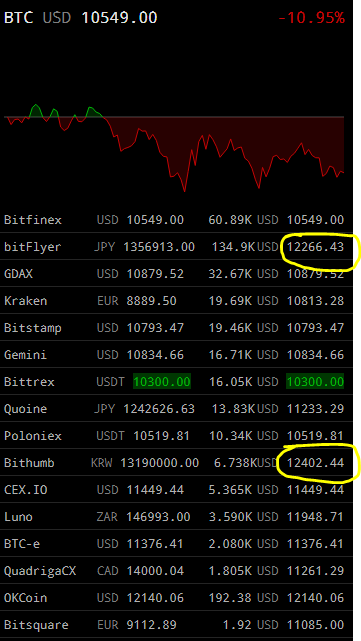
This indicates that the two countries, especially Japan, are indeed starting to nibble at the lower prices. Indeed, the premiums have also come down a bit and price in the top two cryptotrading countries are now more normal compared to the rest of the world.
To be clear, there is still a premium but the market does seem to finally be evening out.
As always, let me know if you have any questions or if you need anything further.
eToro, Senior Market Analyst
Disclosure: This content is for information and educational purposes only and should not be considered investment advice or an investment recommendation. Past performance is not an indication of future results. All trading carries risk. Only risk capital you're prepared to lose.
