Even though the month of June is not over yet, the technical action in gold, as well as some of the gold stocks, have been impressive. So far in June the Spyder Gold Trust (GLD (NYSE:GLD)), which reflects the performance of gold bullion, is up 2.5%. In contrast, the Dow Jones US Gold Mining Index ($DJUSPM) is up 8.5% with the VanEck Gold Miners (GDX) up just over 9.6%.
Does this outperformance in June mean the gold mining stocks are better for investors or traders?

TOMASPRAY – VIPER REPORT.COM
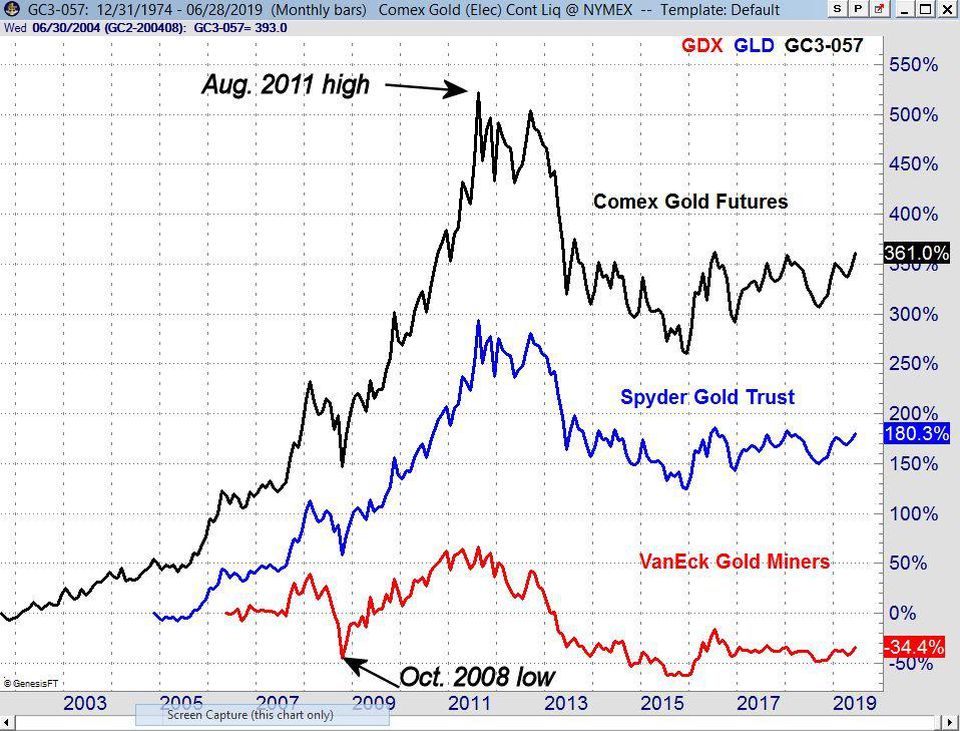
This monthly chart lets the reader compare the impressive performance of the Comex Gold Futures, GLD and GDX from the October 2008 low to the August 2011 high. The largest gain was seen in the gold futures which were up 370%. The Spyder Gold Trust (GLD) was up 237% and the VanEck Gold Miners (GDX) gained 124%.
However, all three declined sharply from the 2011 high but only GDX dropped below the October 2008 low in 2015. Comex Gold declined over 260% from its high but stayed well above the October low as did GLD which was down 172%. Let’s examine the technical charts on these three markets.
The monthly chart of the Comex Gold perpetual contract shows that it has currently moved higher in June but is still below the resistance from 2014 in the $1390-$1400 area, line a. The February high at $1349 has been slightly overcome this month.
The monthly OBV was very strong in early 2018 as it made a significant high. A move above the resistance at line b, is needed to complete a major bottom. The Herrick Payoff Index (HPI) moved above the zero line in January indicating that the money flow had turned positive. This month the HPI is positioned to move above its WMA.

TOMASPRAY – VIPER REPORT.COM
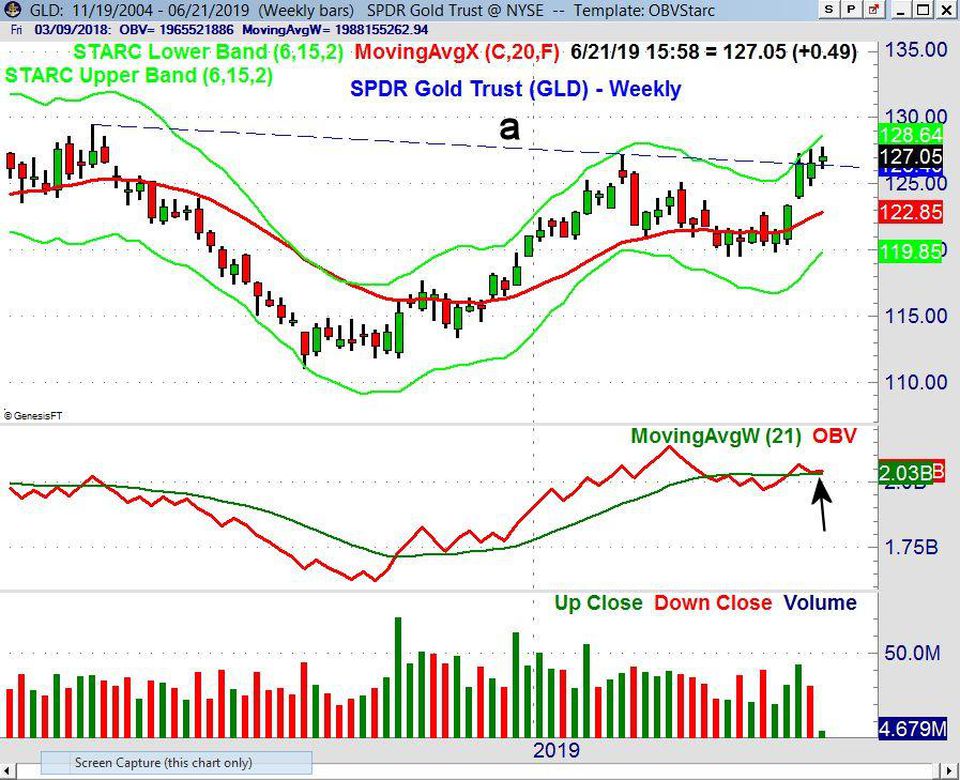
The SPDR Gold Trust (P:GLD) is up 0.44% on Tuesday’s close which is starting off the week on a positive note. For the past three weeks GLD has been trading near the weekly starc+ bands as the downtrend, line a, is also being tested. There is resistance from 2016 in the $130-$131 area.
The weekly OBV is holding just above its WMA as volume so far this week has not been impressive. A higher close on good volume would turn the weekly OBV quite bullish. The daily OBV (not shown) does look very strong. There is initial support now in the $124-$125 area with the 20 day EMA rising sharply at $124.69. The rising 20 week EMA and stronger support currently is at $122.68.

TOMASPRAY – VIPER REPORT.COM
The VanEck Gold Miners (GDX) is the most widely followed gold mining ETF. This ETF has 46 holdings, an expense ratio of 0.53%, and an average volume of 23.4 million.
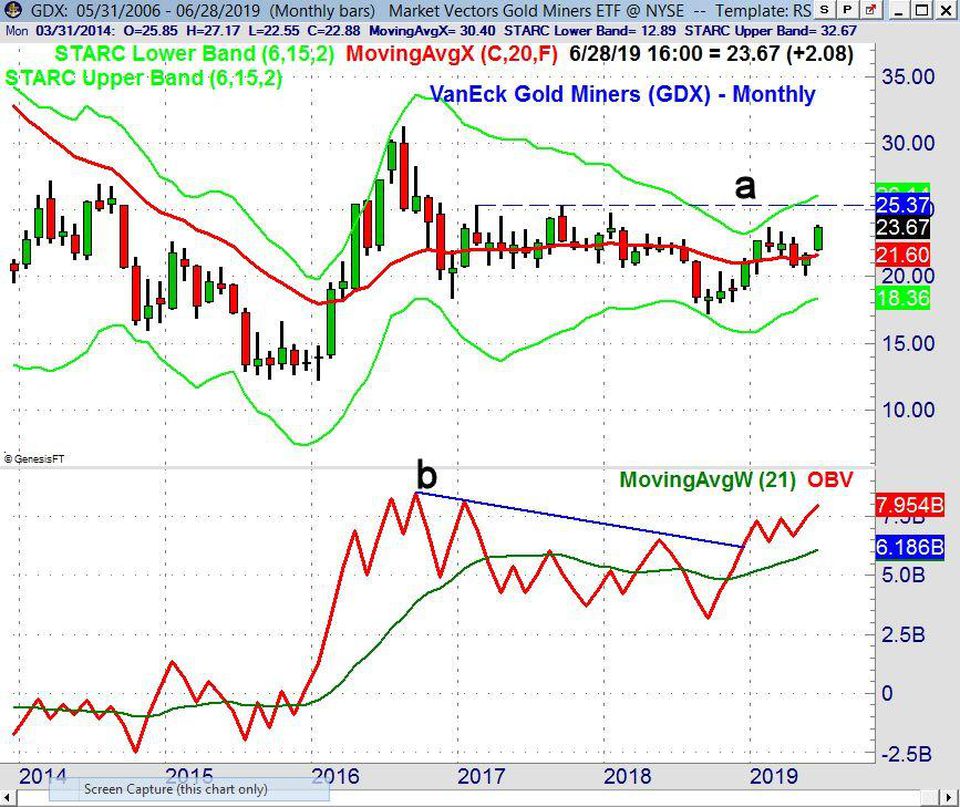
GDX closed Tuesday at $23.67 which is just below the February high of $23.70. There is stronger resistance from 2017 at $25.37, line a. In August of 2016, GDX had a high of $31.28 which was still well below the 2011 high of $63.47.
The monthly OBV moved above its WMA in November 2018 and then in December it overcame the downtrend, line b. The OBV has since made a series of higher highs in 2019. It is acting stronger than prices and is well above its rising WMA. The weekly OBV (not shown) is above its WMA but is still below the February high. There is daily chart support in the $22.20-40 area.
On a near term basis the gold futures, GLD and GDX, are all currently in a moderately high-risk buy area. This does not mean they can’t go even higher, but it does suggest that in the next month or so that they will see a 2-4% correction.
All three have are relatively high-risk investments and the gold futures are clearly not suitable for most investors. In my opinion, GLD has a better risk/reward profile than GDX for most investors and traders. The FOMC announcement could move the gold market this afternoon.
If you are interested in my method of analysis you might consider the Viper ETF Report or Viper Hot Stocks Report. Each is only $34.95 per month.
The VanEck Vectors Gold Miners ETF (NYSE:GDX) (GDX) was unchanged in after-hours trading Thursday. Year-to-date, GDX has gained 7.79%, versus a 11.31% rise in the benchmark S&P 500 index during the same period.
GDX currently has an ETF Daily News SMART Grade of C (Neutral), and is ranked #8 of 34 ETFs in the Precious Metals ETFs category.
