Until recently, the U.S. stock market had been taking Federal Reserve rate hikes and quantitative tightening (QT) in stride. The investment community had come to believe that corporate tax reform would compensate for the gradual removal of ultra-easy interest rate stimulus.
Indeed, up through October, rising interest rates had been hurting bonds far more stocks. Corporate credit assets of all sizes and shapes have logged total return losses year-to-date. The last time this happened? 2008.
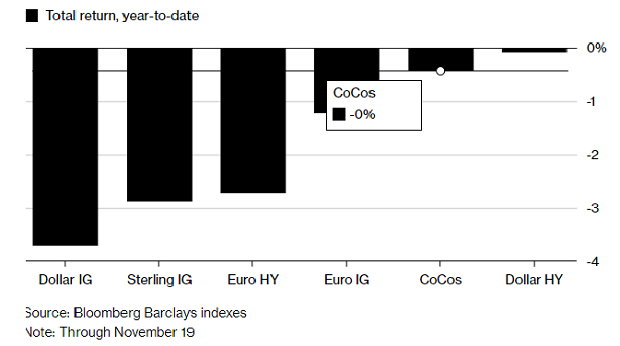
Lately, however, sellers have been overwhelming buyers in the stock arena. The volatility has led prominent figures to speak out. Entertainer Jim Cramer squawked about the Fed being out of touch with economic reality. And President Trump said, “I’d like to see the Fed with a lower interest rate. I think the rate’s too high.”
Will higher interest rates slow the economy to a crawl? Could Fed policy tip the scales toward recession? Perhaps.
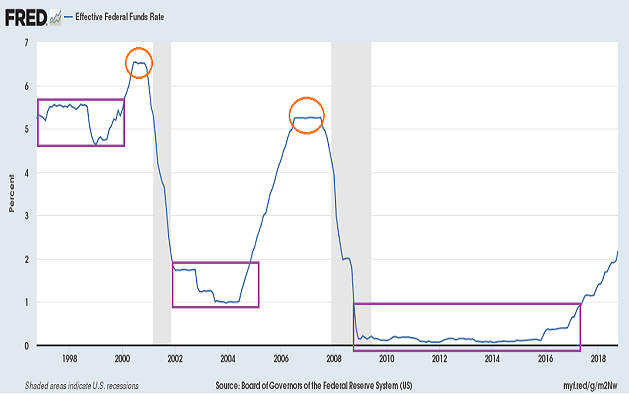
The greater reality, though, is that manipulating rates lower for extended periods of time creates asset bubbles. The tech bubble in 2000. The housing/subprime bubble in 2008.
Did the Federal Reserve foster a third balloon? What some refer to as the “everything bubble?” Yes, they did. What is far less certain is whether or not the balloon is destined to burst.
The Fed’s unspoken goal is to let just enough air out of the asset balloon so as to preserve the wealth effect. On the other hand, when the central bank of the United States chose to manipulate the cost of money lower for the better part of a decade, the inevitable borrowing binge pulled future economic growth into the present. It follows that as credit becomes more expensive and/or more difficult to access, economic growth will suffer.
There are those who feel that if the Fed backs off its planned pace of rate hikes and balance sheet reduction, investors will get a lengthy respite from stock depreciation. Historical evidence suggests otherwise. (See the orange circles in the chart above.)
When the Fed downshifted from a rate-hiking path to a neutral stance in early 2000, the stock market collapsed and the economy contracted shortly thereafter. Similarly, the “neutral” plateau in 2007 provided a false sense of security. Stocks began cratering in October of 2007 and the Great Recession that followed exacted an epic toll.
If the Fed goes “neutral” here in December of 2018, will it be a long-lasting cause for celebration? Or will it represent the proverbial calm before an inevitable storm?
Fed officials have already been sending up smoke signals into the investing atmosphere. Whereas four more rate hikes were a foregone conclusion as recently as September, Fed Chairman Powell and Vice Chairman Clarida made conciliatory comments last week.
Clarida explained that the Fed Funds overnight lending rate is getting closer to a “neutral” level. Meanwhile, Powell acknowledged that there are “…growing signs of a bit of a slowdown for 2018.”
So will the central bank of the United States end its tightening phase sooner rather than later? Do these about-face admissions signify a dovish pivot?
Regardless, monetary policy makers may have already overshot. Consider Morgan Stanley’s recent findings on the failure of “buy the stock dip” in 2018. Researchers evaluated rolling five-day declines in the S&P 500 and discovered that, on average, the sixth day generated a loss.
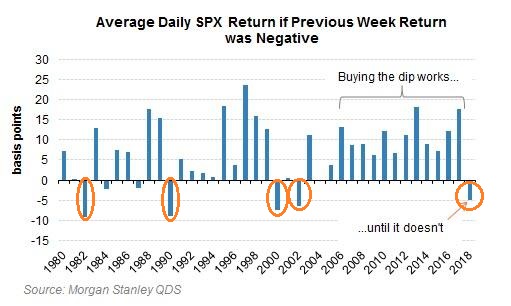
Not a big deal? Maybe not. Then again, this is the first occurrence since the 2000-2002 tech wreck. What’s more, other years when buying the dip did not work included significant recessionary stock bears (e.g., 1982, 1990, etc.).
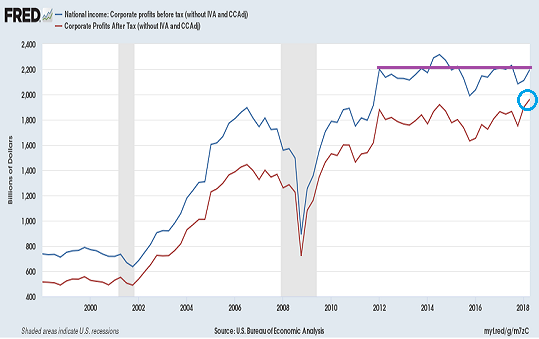
Why is “buy the dip” faltering in a year when after-tax corporate earnings are still breaking records? Primarily, the stock market is a forward-looking entity. And it recognizes the difference between sustainable corporate profit growth and stimulus-laden benefits.
According to Lance Roberts, during the current bull market cycle, a meager 11% of total reported earnings-per-share (EPS) growth has come from an increase in sales. This implies that EPS growth has largely been the beneficiary of corporate share buybacks, accounting sleight-of-hand and cost cutting activity. Absent the stimulative effects of ultra-low interest rate policy and additional fiscal tax cutting, profitability may not be quite so impressive in 2019 and beyond. In fact, before-tax corporate profits are no better than they were in 2012.
What about an early Santa Claus rally in December? It’s certainly possible. President Trump might strike a deal at the G-20 meeting with China’s President Xi Jinping. More likely, if both parties agree to delay tariff increases slated for January 1, we could see a bit of upside.
Nevertheless, it is the Federal Reserve that wields far more influence on financial markets. Its gradual rate hike path coupled with balance sheet shrinkage has led to a wide range of concerning outcomes. For instance, in real estate, home sales have declined in nine out of the previous 10 months, while one-third of homes for sale slashed asking prices in October.
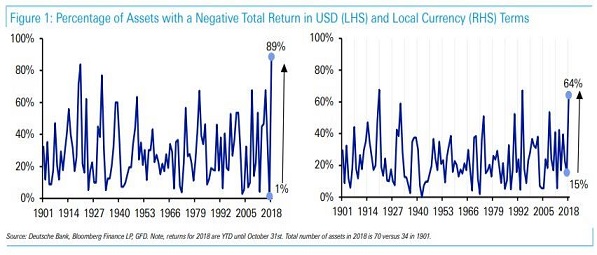
That’s not all. According to Deutsche Bank, on a long list of asset classes that it tracks, 89% are negative in total dollar return on the year. Analysts at Deutsche maintain that this is the worst percentage since 1901.
The focus for U.S. investors, though, remains with the large cap U.S. stock indices (i.e., Dow, S&P 500, Nasdaq). And here, hope still springs for 2018.
That said, my purpose is not to buy “good stuff” for clients and hope that the “good stuff” will reward for eternity. My purpose is to minimize loss as well as emotional hardship when the risk-reward environment is unfavorable. When the risk-reward relationship improves markedly, this is the time to “maximize returns.”
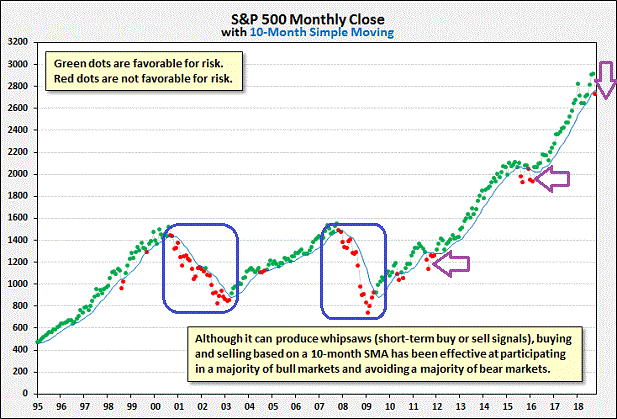
In my commentary from 10/31, I explained the reasons for reducing our large-cap U.S. stock exposure (effective 11/1). And that meant lowering an approximate 60% allocation for most of our near-retiree and retiree client base to 35%. (Note: Some moved from 65% to 40%; others downshifted from 55% to 33%.)
Only time will tell if the tactical decision to lower risk at an effective close of 2740 on the S&P 500 will be beneficial for total financial return. What I do know for certain? The same approach for lowering risk — the use of the monthly close on the 10-month moving average — helped me sidestep the magnitude of the 2000-2002 tech wreck and the 2008-09 financial collapse.
Worst case scenario? We remove hedges and restore risk with a “green light” signal.
Disclosure Statement: ETF Expert is a web log (“blog”) that makes the world of ETFs easier to understand. Gary Gordon, MS, CFP is the president of Pacific Park Financial, Inc., a Registered Investment Adviser with the SEC. Gary Gordon, Pacific Park Financial, Inc., and/or its clients may hold positions in the ETFs, mutual funds, and/or any investment asset mentioned above. The commentary does not constitute individualized investment advice. The opinions offered herein are not personalized recommendations to buy, sell or hold securities. At times, issuers of exchange-traded products compensate Pacific Park Financial, Inc. or its subsidiaries for advertising at the ETF Expert website. ETF Expert content is created independently of any advertising relationship.
