Back in April with the Shanghai Composite at 4500, I argued that the market had at least 25% more upside. That was clearly wrong. It only had 15% more upside before turning back just under 5200 on the Shanghai Composite in June. The technicals kept you in the market during the shake ‘n’ bake into early May, and should have gotten you out, as it spent too much time under the 20 day SMA in June. But what do the technicals say now? Actually, a lot.
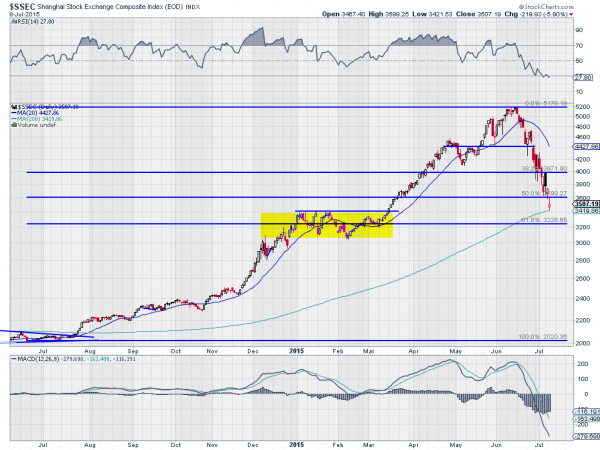
The chart below shows the full move higher out of the consolidation range in July 2014 to the peak in June 2015 and the current pullback. There are 5 things to watch for going forward and this chart helps to illustrate them.

The first is the 20 day SMA, the rising darker blue line. Notice over this entire period that when the index is over the 20 day SMA, it is rising and when below it for any significant period of time, it falls or moves sideways. It has been below the 20 day SMA since June 18th, remaining a sell signal.
Next is the smoother light blue 200 day SMA. Notice on this indicator that the index moved above it in July 2014 and started the rally. The pullback is now at the 200 day SMA for the first time since then. There is no special significance to the price level at the 200 day SMA, but the average is an important indicator of health of a trend. Yes, it is a long way below the top in June, but it is also a long way above the base from July last year. A sustained and prolonged move in the index below the 200 day SMA would be an indication that there is more downside to come.
There are also Fibonacci retracement lines drawn on the chart from the low to the high. Notice that the index has retraced over 50% of the move higher now, and is close to a 61.8% retracement at 3226. This 61.8% ratio is an important one. Fibonacci ratios exist all throughout nature, and it is thought that because of this, they have a pleasing view in market charts as well. What is more important is that many traders will look for a a retracement to this ratio and then a bounce. There are likely to be buy orders around there. A blow through it would be significant.
The fourth thing to look at is the momentum indicator RSI at the top of the chart. It is now in an oversold condition. That does not mean it cannot get more oversold and continue lower, or that the momentum could not just remain level at this place for some time while the index drifts lower. Both could happen. But this level in momentum shows a possible place, from one indicator of exhaustion to the downside. If many more line up, it could lead to a reversal in the index.
Finally, and most importantly, is the price action itself. Every candlestick shows price history. A battle between buyers and sellers. And when many of then line up in a tight zone, the battle involved a lot of money and possibly many investors. This is how you should look at the yellow box from December 2014 until March 2015. A range in the index from 3050 to 3400. It has a lot of price history, and can therefore become a place where a big battle is fought again between buyers and sellers. If the sharp pullback in the Shanghai Composite wants to stop and reverse or at least take a breather, this a logical place where that could happen.
Now put the last 4 of these together. The Composite is at the 200 day SMA. It is approaching the 61.8% retracement. The momentum is oversold, and the previous price consolidation zone encompasses this entire area. If ever there were indicators lining up to the Shanghai Composite to stop falling, this is the area. That means two things. First, if you are betting on the downside, be prepared to take profits. Second, if this confluence of indicators does not stall the fall, the Chinese market could have a whole lot of ugly still left in it.
Disclaimer: The information in this blog post represents my own opinions and does not contain a recommendation for any particular security or investment. I or my affiliates may hold positions or other interests in securities mentioned in the Blog. Please see my Disclaimer page for my full disclaimer.
