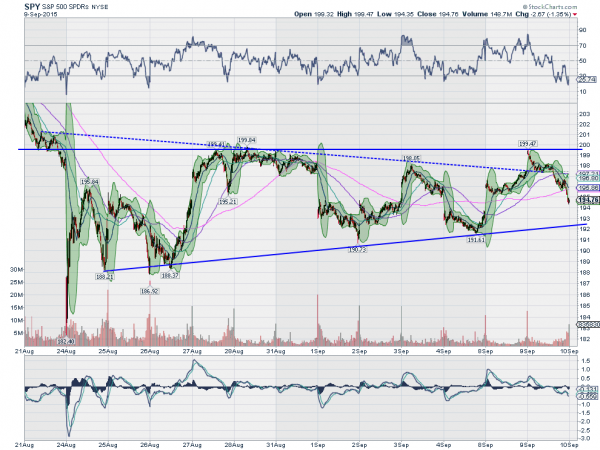
Wednesday started out so promising for the S&P 500. A gap higher over a symmetrical triangle could be the reversal that sounded the all clear signal. But as soon as the market opened, the S&P started to sell off. And after a steady trend down day, ended right back in the middle of that triangle. It was so unhappy that the S&P ratings agency downgraded Brazilian debt to junk.
Many will look at that move and failed break out and suggest that the markets are doomed. But remember there was one line in yesterday’s remarks about the index:
![]()
‘A move over 200 would add even more strength’. That did not happen. So it is with the risk of being attacked for changing the picture to suit the environment that I present a new view of the S&P 500.

The prior S&P 500 symmetrical triangle is left in as the dotted line, but the new solid line at the top creates an ascending triangle. This triangle shows a solid bounce off of the top at about 119.50 and reversal towards the bottom, now at about 192. Why did I redraw this? Not because I need to be right, but because I want to be right. Right about risk management. And the new line is important because the price action Wednesday showed us that it is important. A shift in triangles from symmetrical to ascending.
So moving into Thursday, the downside has a preference with 192 a level of interest and then the bounce points at 191.60 and 190.73 before 188.37. Any of those levels or none of them could end up giving support. And with the oversold RSI, it could just as easily go up. There are no crystal balls here, just observations of areas of interest that can be used for risk management.
The information in this blog post represents my own opinions and does not contain a recommendation for any particular security or investment. I or my affiliates may hold positions or other interests in securities mentioned in the Blog. Please see my Disclaimer page for my full disclaimer.
