Is an important paradigm shift about to take place?
Could be.
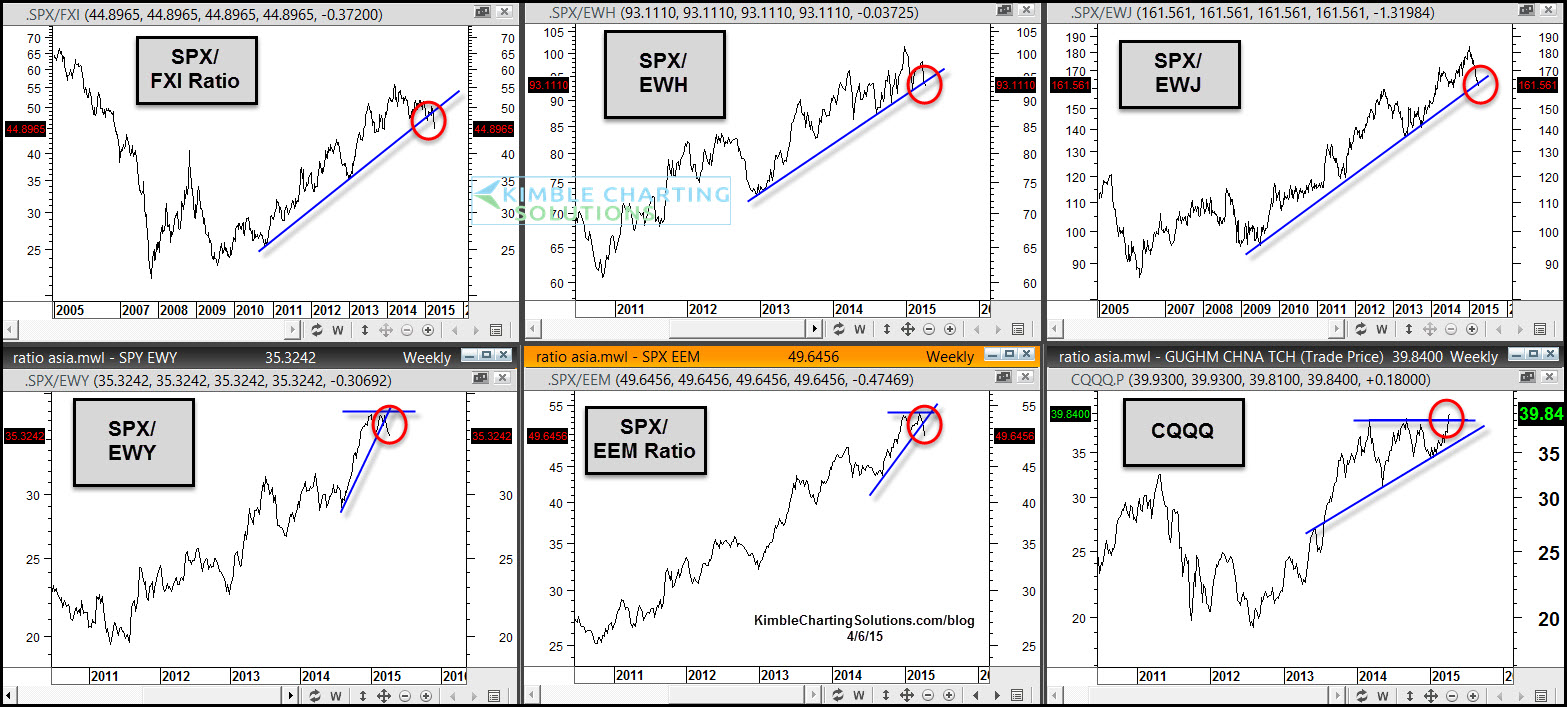
For the past few years, the S&P 500 has been a much better asset to own when comparing performance against China, Hong Kong, Japan, South Korea and Emerging Markets. The 6-pack below looks at 5-ratios comparing the S&P 500 against several international ETFs. When the ratio is heading higher, it means that the S&P 500 is stronger.

As the ratios have headed higher over the past few years, it has paid to be long the S&P 500 against these ETFs. Lately a few support lines are starting to give way, showing that the S&P 500 has been weaker against these ETFs.
When it comes to global investing, one has to ask whether or not a paradigm shift is taking place. If these ratios head lower, it would reflect global strength against the S&P 500, which has been rare over the past few years.
I shared last week that crude oil averaged a 50% gain 12 months out, after it created a 10% reversal pattern, following a 40% decline over the past year.
If crude manages to do well over the next 12 months, the ratios above could keep heading lower.
The lower right chart of the 6-pack above reflects an attempt by Chinese tech companies to breakout of the bullish ascending triangle pattern in (NYSE:CQQQ).
