So Janet listened to Elvis and stopped talking about a hike and actually did it. Good for her. The market seemed to love it, well maybe they liked it. The S&P 500 moved up by 1.45%. But what is next?
Short term maybe we finally get that Santa Claus Rally. Seasonally this is a a time for the equity markets to rally. There are some important price levels that may stand in the way of a full fledged move higher though. Let’s look at a chart.

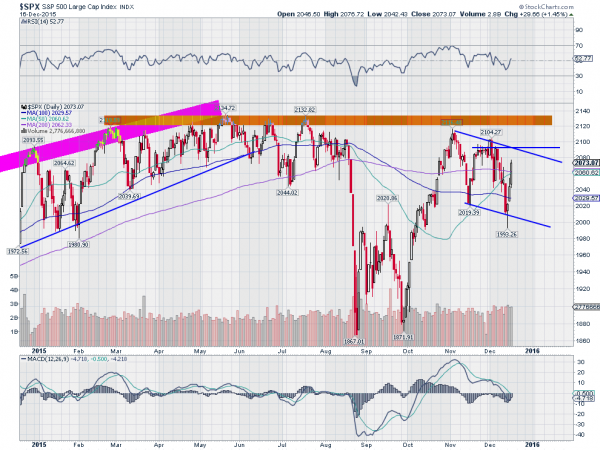
The chart of the S&P 500 above shows the price action for 2015. There was a whole lot of nothing happening the first 7 months and then the drop in August. A double bottom formed in September and then a move back to near the July highs.
It is important to note that although close to the July highs, it was actually a lower high. And since then there have been now a lower high and a lower low. A downtrend is underway in the intermediate timeframe. Wednesday’s move is promising but does not change that. What would?
There are several price points and other indicators to watch. First is the 2090-2095 area. This is the top of the falling channel and the last resistance area. A move over this level would make the equity market look much more bullish. Second is 2100 the end of November high. Follow that with the 2120 to 2135 area. Clearly a move over that to new all time highs would be bullish.
Momentum is on the side of higher prices in the short term. The RSI is in the bullish zone and crossing up through the mid line. And the MACD is turning higher towards a cross up. If both continue then you can look for new highs in the coming months.
The information in this blog post represents my own opinions and does not contain a recommendation for any particular security or investment. I or my affiliates may hold positions or other interests in securities mentioned in the Blog, please see my Disclaimer page for my full disclaimer.
