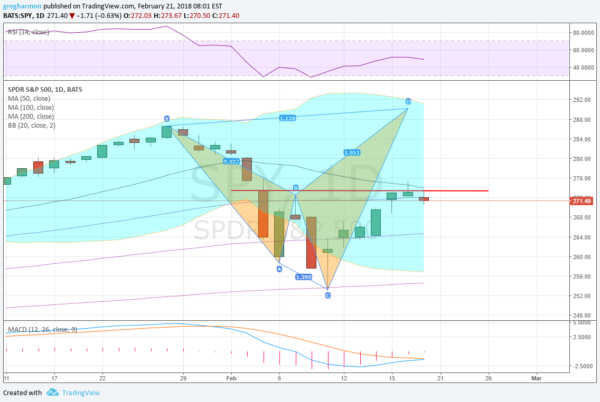
The S&P 500 had a massive run higher in January. When it peaked toward the end of the month, investors were ecstatic. But then the mood changed. Volatility crept in and the S&P 500 had its first 10% correction in almost 2 years. The bottom (so far) came when it touched the 200-day SMA on February 9. This was also a 38.2% retracement of the long run higher following the presidential election.
But since that bottom it's had a steady 5-day run higher. That streak ended Tuesday with a small pullback. The S&P 500 has stalled at the confluence of its 20- and 50-day SMAs. Along the way the price action has traced out what could become a harmonic Shark pattern. It would take a push higher through the current resistance to confirm this and then it establishes a target to 290.

There is trouble with the short term bullish case though. There is that resistance proving to be tough to get through. But there is also momentum fading in the RSI before a return to the bullish zone and the MACD failing to cross up. On the other side of the argument, sentiment is near extreme bearish levels. The CNN Fear/Greed Index for example is pointing to Extreme Fear and has been there for about a week. And corporate earnings are coming in very good with estimates on average for future earnings rising.
No one know what will happen in the S&P 500. It may reverse back lower and hit that 20% correction some are looking for. It may break through to the up side and continue for another 10% higher. Or it may befuddle everyone and just churn sideways for months. Follow these short term levels for clues and to be ready when it finally decides where it is going.
DISCLAIMER: The information in this blog post represents my own opinions and does not contain a recommendation for any particular security or investment. I or my affiliates may hold positions or other interests in securities mentioned in the Blog, please see my Disclaimer page for my full disclaimer.
