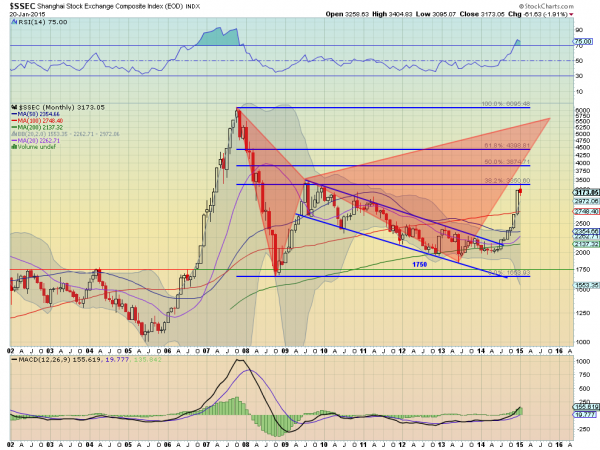
The broad Chinese market took a massive hit with the financial collapse in the US in 2008. But unlike the US and European markets, it did not bounce back to new all-time highs. Instead it only could create a 38.2% retracement of that downward move, before retreating again. It looked like the Shanghai Composite would never turn around until late in 2014. But now that it has, there is a lot of goodness in this chart.
The long term monthly chart below has a lot to say. First notice that the falling channel of price that lasted from late 2009 until late 2014 reversed when it touched the 200 month SMA. Once the price broke the channel to the upside it accelerated until it hit the 38.2% retracement line again, the peak in 2009.

A pause or consolidating pullback at this point would be welcome. Not only has the momentum indicator RSI become overbought, but the price has moved outside of the upper Bollinger Band® for several months in a row. A pullback to reset the RSI and get back within the Bollinger Bands would work off that overbought condition. With the MACD rising and far from the previous high, the Shanghai Composite could then reverse back higher again.
That would fit well with the bearish Bat Harmonic in the chart. This has a Potential Reversal Zone (PRZ) at 5590 to the upside. And don’t forget that a Bat can always morph into a Crab. That would shift the PRZ higher to just over 8000.
Finally the Point and Figure chart also broke out to the upside in November 2014. Using the Average True Range (ATR) for the box size it now carries a price objective to at least 6312.
The Shanghai Composite is certainly biased to the upside for the long term investor. In the short run, it would not surprise though to see a pullback to the 2750 area, where the 100 month SMA sits, and where 3 box reversal Point and Figure chart with a 25 point box size looks to right now as a price objective. One thing to consider if you missed the run up so far: if the Shanghai Composite gives you a pullback to 2750 and holds will you miss the next leg higher?
Disclaimer: The information in this blog post represents my own opinions and does not contain a recommendation for any particular security or investment. I or my affiliates may hold positions or other interests in securities mentioned in the Blog, please see my Disclaimer page for my full disclaimer.
