Xi Jinping does not look happy, and who can blame him. Maybe it is just a coincidence, but since the middle of January his stock market is down over 25%. I am not going to say that the tariff talk has had anything to do with it, you can come to your own conclusions. It has been a rough road though. The question now is whether or not the damage is over.
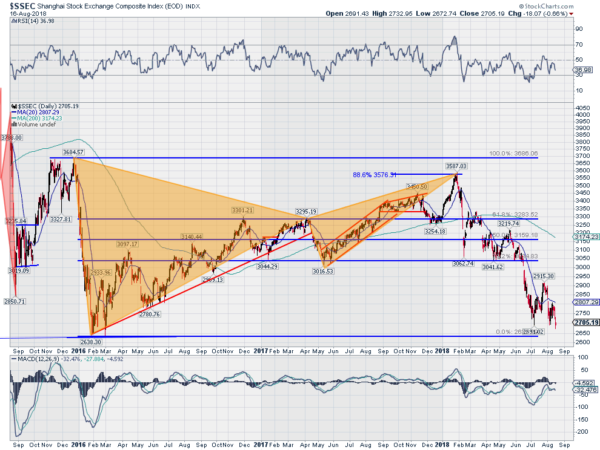
The price action has its own perspective. The chart below shows the Shanghai Composite over the last 3 years. The Bat harmonic pattern highlighted dominates the picture. First the dramatic fall to a February 2016 low and then the steady climb over the next 15 months. A minor set back to the May 2017 low and then another leg higher to a top in January.
The retracement from there was quick to the 61.8% retracement and a bounce back to the first target at the 38.2% retracement. This was followed by a gap and continuation to the second target at a 61.8% retracement where it consolidated against support this time. By June it was moving lower again and with the close Friday at 2669 it is just 31 points form a full retracement of the run higher. Will that be the end?
The momentum indicators suggest more downside to come. Neither the RSI nor the MACD are in oversold territory but both remain in bearish zones. The price remains below the falling 20 day SMA as well. The one item in the chart that bulls may point to is that the price is getting very far from the 200 day SMA. But a quick look to the left shows that it has been a much greater differential in early 2016, it can always get bigger. Bottom line: It does not look like Xi Jinping will be smiling anytime soon.
The information in this blog post represents my own opinions and does not contain a recommendation for any particular security or investment. I or my affiliates may hold positions or other interests in securities mentioned in the Blog, please see my Disclaimer page for my full disclaimer.

