Herewith a quick review of the stock market's sordid “personality” historically during the month of September. I've broken it into three periods, referred to sequentially as the “good”, the “bad” and the “ugly.”
- The “Good”: the first three trading days of the month of September
- The “Bad”: All trading days between the 3rd trading day of September and the 10th to last trading day of September
- The “Ugly”: The last 10 trading days of September
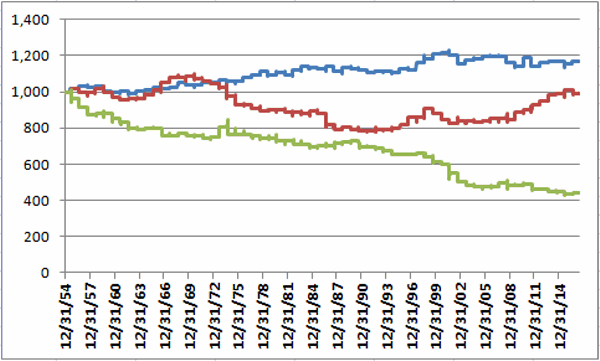
Figure 1 displays the growth of $1,000 invested in the Dow Jones Industrial Average during each of these three periods starting in 1955.

Figure 1: “Good” (Blue), “Bad” (Red) and “Ugly” (Green) periods.

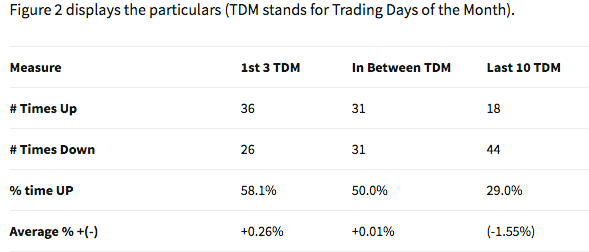
Figure 2: “Good”, “Bad” and “Ugly” performance.
Key Points:
- The “Good” showed a gain 58.1% of the time with an average gain of +0.26%
- The “Bad” showed a gain 50.0% of the time with an average gain of +0.26%
- The “Ugly” showed a gain only 29% of the time with an average loss of -1.55%
- The cumulative loss for the “Ugly” period is -56.1%
Summary
September is just around the corner people. Enjoy it while you can.
Then, maybe gird your loins.
