Price by itself can very quickly change the tone in markets, and we saw a very clear example of that in the latest weekly sentiment survey on Twitter. With the S&P 500 closing above its 50-day moving average on Friday and apparently completing a so-called "W-shaped recovery", technicals sentiment rebounded sharply on the week. Fundamentals sentiment also rebounded, and is part of a wider and critical set of data points which help shed light on the outlook for markets.
Indeed, equity fundamentals sentiment is running at very optimistic levels, and while it seems short-term at odds with what we are seeing in the bond survey, there are a couple of key supporting points. For one, economic data has been surprising to the upside, and earnings revisions momentum has been heating up. Pair this with the backdrop of booming economic confidence, and it certainly paints a picture of supportive fundamentals.
While some of these indicators may be close to mean reverting, and the business cycle is steadily maturing, it's a backdrop that in the near term that provides some justification for optimism in markets. And for now, as the technical analysts might say, the trend is your friend.
The main points and conclusions for investors are:
- Overall equity sentiment rebounded strongly on the week.
- Technicals sentiment jumped the most as a couple of key technical signals lit up on Friday.
- Fundamentals sentiment likewise rebounded to optimistic levels, and is consistent with what we are seeing in economic sentiment and earnings revisions.
- With the improving technicals set against a backdrop of booming economic confidence the path seems clear for further upside for equities from here.
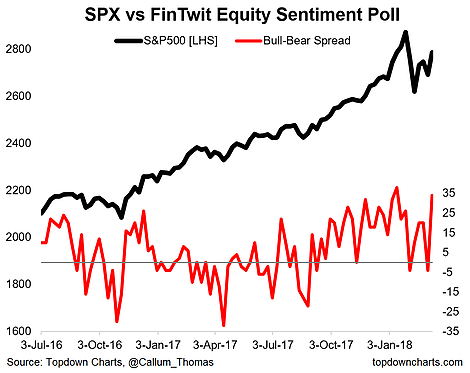
1. Equity Sentiment: The latest equity sentiment survey on Twitter showed a sharp rebound in overall net-bullishness with the bull-bear spread rising to 34 from -4 last week. This represents a substantial shift in sentiment, and as I discussed in the Weekly S&P500 #ChartStorm - there is a distinct change in mood from "Fear Of Missing Out" in progress.
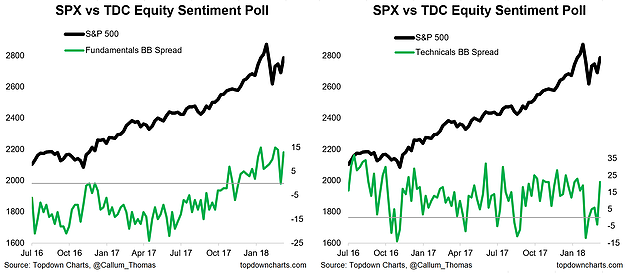
2. Technicals vs Fundamentals: Looking at the separate bull/bear spreads for fundamentals vs technicals you can see that it's on both fronts that sentiment is rebounding, but particularly so on the technicals front - key as the S&P500 appears to be completing the so-called "W-shaped" recovery and on Friday recaptured the 50-day moving average. As long as we don't see any deterioration on the fundamentals front the technicals aspect is likely to set the tone (buying and FOMO) in the coming days and weeks.
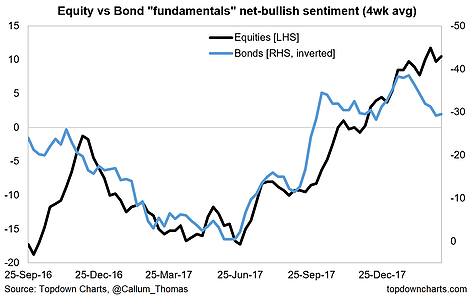
3. Fundamental Sentiment: On the topic of fundamentals, the fundamentals sentiment line remains bullish/optimistic for equities, in contrast to bonds where there has been a tempering of the extreme bearishness previously seen (note: bond fundamental sentiment is shown inverted to line up intuitively with equity fundamental sentiment). In this respect, it remains to be seen whether bond investors or equity investors will end up being "right".
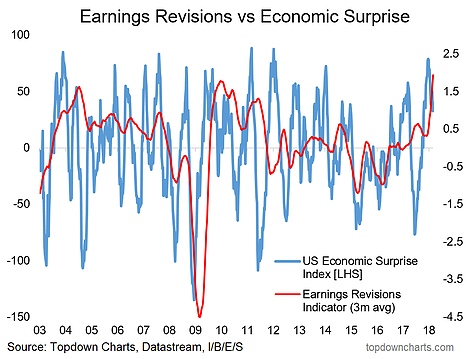
4. Economic/Earnings Sentiment: Sticking with the theme of fundamentals, this chart shows two indicators which I basically interpret as types of sentiment indicators. The economic surprise index while reflecting trends in actual data, often gives you more insight into how optimistic or pessimistic economists are (e.g. if they are too pessimistic then even average data will surprise and send the index higher). Likewise I consider earnings revisions momentum to be a sort of analyst sentiment (even though again it also reflects actual economics also). In this respect the string of economic surprises and uptrend in earnings revisions are consistent with what the survey respondents are saying with regards to their view on equity fundamentals.
5. Economic Optimism: Finally, to round it out, I have included a chart which provides a broad composite view of economic confidence or economic optimism for the US economy, and with most metrics here running at decade+ highs, it again is consistent with the optimism seen on equity fundamentals and indeed also for the fundamental bearishness seen for bonds. So with improving technicals lining up against a backdrop of booming economic confidence the stage looks set for further upside.
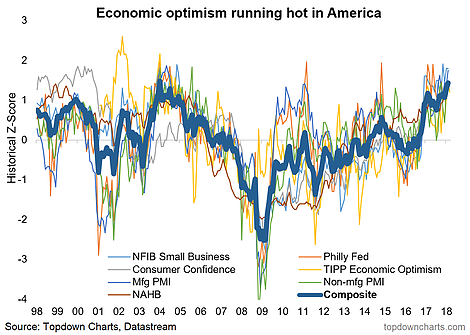
I don't like price targets but it seems reasonable to expect that the S&P500 could go on to new highs from here, and even brush up against the 3000 level. The final caveat of course is that these last 2 charts are around levels where you often see mean reversion kick in and we are increasingly late cycle, so as always be mindful of risk management and disciplined in your investment process.
