I am re-reading Justin Mamis' book, The Nature of Risk, a worthwhile read by the way, and being reminded of the dissemination of information prior to the internet age, which is difficult for many to believe if they did not work in investments at that time. Simply gauging market sentiment prior to each day's market open at that time was much different than it is today, of course. As he notes in his book, when one inquired about, say, a higher market, the most appropriate answer was there simply were "more buyers than sellers" that day. In today's proliferation of business cable channels, that type of response will not sell many advertisements.
This focus on buyers and sellers is really an evaluation of investor sentiment and is one reason I write about sentiment reports on a fairly regular basis. To that end, the American Association of Individual Investors reported Sentiment Survey results last week and individual investor bullish sentiment jumped 7.1 percentage points to 59.8%. Most of this bullish improvement came from the prior week's bearish survey participants as bearish sentiment decline 5.1 percentage points to 15.6%. This spike in bullish sentiment can be seen in the below chart featuring the S&P 500. 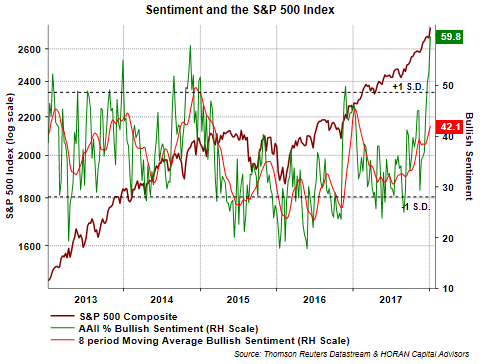
Also included in the above chart is the less volatile 8-week moving average of the bullish sentiment reading and it remains below an extreme level. Below is a chart comparing the above sentiment chart to the time period in the run up to the technology bubble (bottom half of below chart.) Interestingly, the bullish sentiment is near the same level at the end of 1999 as today's current reading. However, the 8-week moving average at the end of 1999 was quite a bit higher. 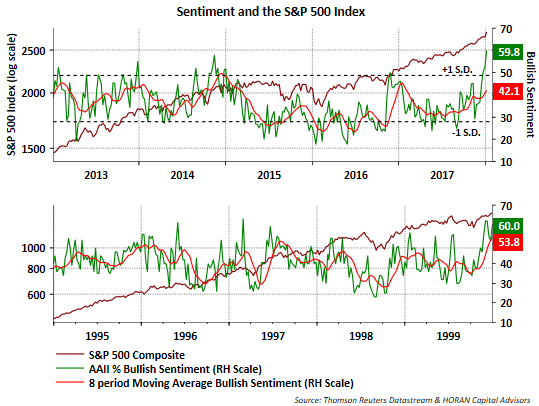
On the institutional side of the sentiment reading equation, the NAAIM Exposure Index has declined to 58%. Certainly not an overly bullish posture being reported by institutional investment managers. The NAAIM Exposure Index consists of a weekly survey of NAAIM member firms who are active money managers and provide a number which represents their overall equity exposure at the market close on a specific day of the week, currently Wednesday. Responses are tallied and averaged to provide the average long (or short) position of all NAAIM managers as a group. 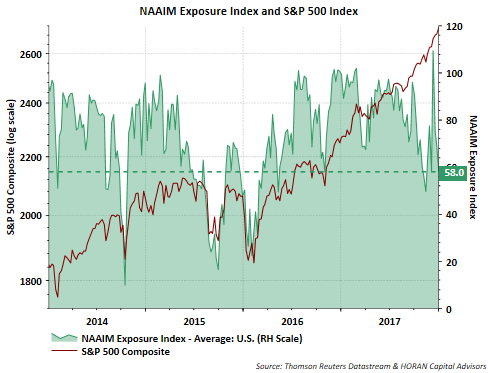
I believe there are a couple of differences between the current market environment and the environments in the run up to the technology bubble and the run up to the financial crisis in 2008. I understand we are much overdue for a market pullback and having been showing charts and discussing it ad nauseum on our blog for the better part of the last six months. A difference with today's market versus late 1999 and the 2008 period is the corporate earnings picture.
As the below chart shows, earnings in the late 1990's and 2005 through 2008 had corporate earnings growth slowing, that is the change in earnings growth was negative. One certain headwind for stocks and the market is a situation where the rate of growth in earnings is slowing. Today, we have just the opposite. Earnings growth is accelerating and with the passage of the recent tax reform package, after tax earnings growth is likely to improve even more. In other words, I believe there is a strong fundamental underpinning to the equity markets at the moment in the form of corporate earnings strength. In late 1999 earnings seem to take a back seat to 'clicks' and the amount of fiber optic capacity, etc. 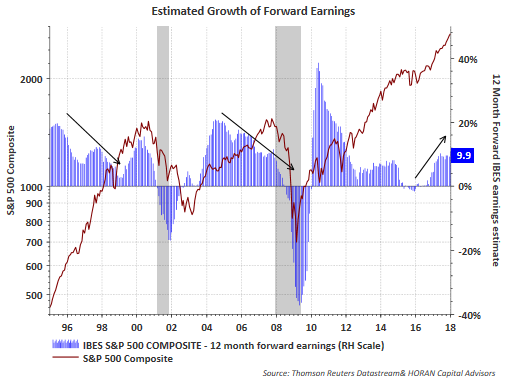
And then there is the valuation picture noted below. The forward P/E for the S&P 500 Index is 18.5 and above the longer run average of 16.2. Yes, valuations are elevated, but in a low interest rate, low inflation environment stocks do trade at higher multiples. PPI and CPI are reported Thursday and Friday, respectively, this week. These reports will be important for investors to pay attention to. Additionally, with the lower corporate tax rate just passed by Congress, the maximum rate reduced to 21% from 35%, after tax earnings will get a boost. This will flow through to a lower P/E multiple. 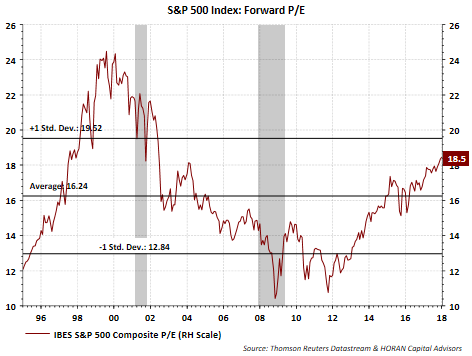
I am feeling like a broken record, but the market will experience a double digit correction. The sentiment measures certainly are neutral to bullish, and since they are contrarian measures, sentiment suggests a market pullback is a reasonable expectation. Noteworthy on the sentiment charts is the fact sentiment levels are most accurate at extreme levels and with the individual AAII sentiment measure, extreme bearishness is a more accurate contrarian measure than extreme bullishness.
