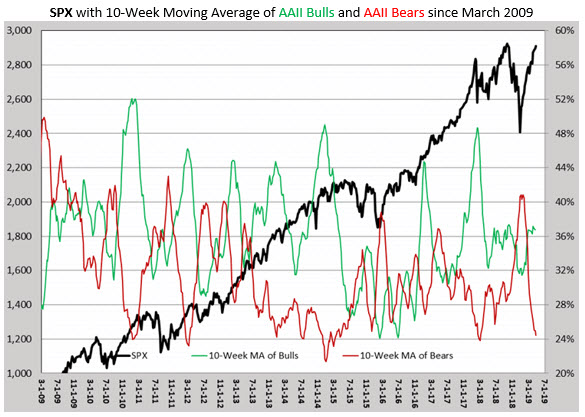
With the major market indexes recently notching record-high closes, it's not too surprising to find bearish sentiment dwindling. In fact, the 10-week average of American Association of Individual Investors (AAII) respondents who identify as bearish -- or, specifically, who feel the stock market will move lower in the next six months -- recently fell below 25% for the first time in more than a year. Below, we take a look at how the S&P 500 Index (SPX) tends to perform after these relatively rare sentiment signals, and explain why a drop in AAII bears doesn't necessarily translate into a glut of bullish investors.
The last time the 10-week average of AAII bears was below 25% was in early March 2018, according to Schaeffer's Quantitative Analyst Chris Prybal. For context, this average was over 40% at the start of 2019, when the major stock market indexes were just off their late-December lows.

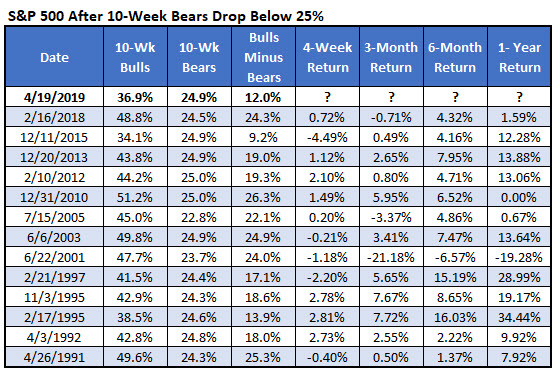
The last time the 10-week average of AAII bears fell below 25% after six months above this threshold was in February 2018, according to Schaeffer's Senior Quantitative Analyst Rocky White. Since 1987 (the first AAII reading), there have been just 14 of these instances, the first occurring in 1991. Prior to the 2018 signal, you'd have to go back to December 2015 for a similar exodus of AAII bears.

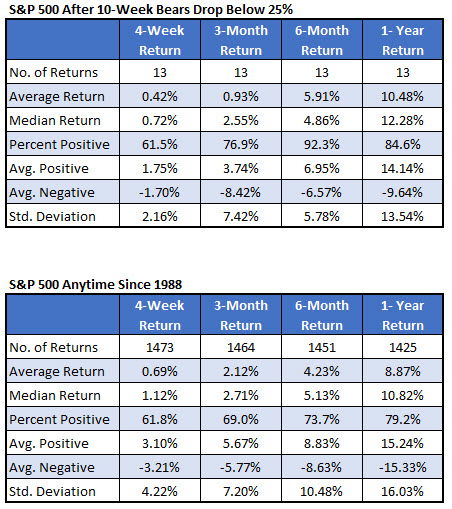
However, when AAII bears fall off a virtual cliff, the SPX tends to underperform in the short term. A month later, the index was up just 0.42%, on average, compared to 0.69% anytime, looking at historical data since 1988. Three months later, the SPX was up 0.93%, on average -- not even half its average anytime three-month gain of 2.12%. However, 76.9% of the post-signal returns were positive at this checkpoint, compared to 69% anytime.
Six months later, though, the S&P was up a stronger-than-usual 5.91%, and was higher a whopping 92.3% of the time! That's compared to an average anytime six-month gain of 4.23%, with a 73.7% win rate. A year after an AAII sentiment signal, the index was up 10.48% and higher nearly 85% of the time, compared to an average anytime annual gain of 8.87% with a 79.2% win rate.

As alluded to earlier, the drop in AAII bears didn't necessarily translate into a surge in bullish respondents. Last week, in fact, the number of self-identified neutral respondents in the AAII survey increased 5.7 percentage points to 46.3%, marking the highest neutral reading since May 2016. And the number of AAII bulls dropped 4 percentage points, to just 33.5% of respondents, even as AAII bears fell another 1.7 percentage points to 20.2%.
You'll also note in the second chart of this article that the 10-week average of AAII bulls sits at just 36.9%. There has been just one other time, in December 2015, when the 10-week average of bulls was lower than that at the same time the 10-week average of bears was below 25%. After that signal, the SPX fell nearly 4.5% in the subsequent month, but managed to rack up an impressive 12.28% over the next year.
In conclusion, since stocks tend to climb a "wall of worry," it's encouraging that AAII respondents aren't jumping from the bearish camp directly to the bullish bandwagon. Nevertheless, previous sentiment signals have preceded weaker-than-usual returns for the SPX in the short term. It's also worth noting that volatility tends to cool down after these signals, as evidenced by the Standard Deviation columns in the charts above -- echoing another S&P signal we uncovered earlier this week.
