Since the February correction and subsequent stock market chop, investors have been reducing their exposure to equities. Not only did exchange-traded funds (ETFs) see a second straight month of negative outflows in March -- something we haven't seen since the financial crisis of 2008, per State Street Global Advisors -- but the latest National Association of Active Investment Managers (NAAIM) exposure index suffered its biggest weekly drop in years.
More specifically, the NAAIM index, which measures stock exposure, recorded the largest weekly point drop since August 2014. As Schaeffer's Senior V.P. of Research Todd Salamone noted, "Two months later, the market bottomed after a brief drop below its 200-day moving average" -- and the S&P 500 Index (SPX) 200-day trendline is also in focus once again, after the index yesterday breached it for the first time since the Brexit backlash.
The NAAIM index also suffered its biggest weekly percentage drop since February 2016, and now sits at its lowest point since Feb. 24, 2016. The index dropped from 77.28 to 49.36 last week, and the deviation between bulls and bears is now at its highest point since November, according to Schaeffer's Quantitative Analyst Chris Prybal.
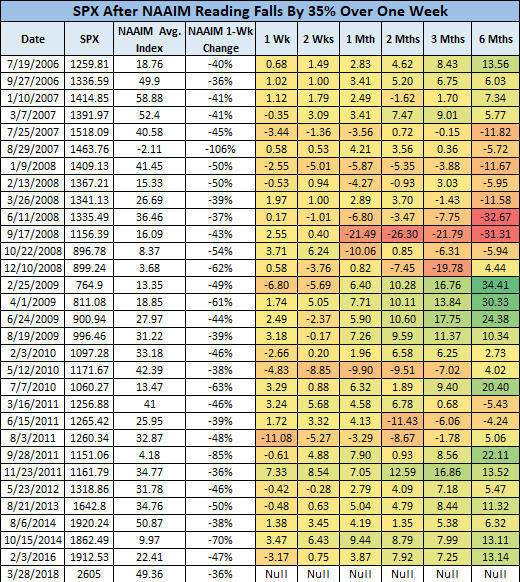
However, if recent history is any indicator, the SPX could enjoy some tailwinds soon. Since 2006, there have been 30 times in which the NAAIM index fell by at least 35% in one week, though none of the signals occurred in 2015 or 2017.

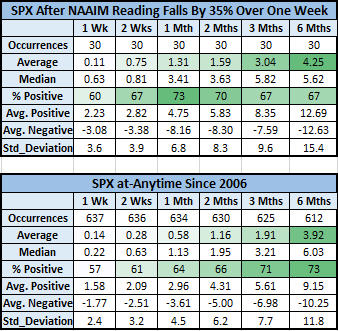
Two weeks after these instances, the S&P was up 0.75%, on average -- more than twice its average anytime two-week return of 0.28%. One month later, the SPX was up 1.31%, on average, compared to just 0.58% anytime. Three months later, the index was higher by more than 3%, on average, compared to an anytime gain of 1.91%.

What's more, if you cut out the signals before 2009, those stock market returns are even better. After the 18 times the NAAIM index suffered a one-week drop of at least 35%, the S&P 500 Index went on to average a one-month gain of 4.2%, and was higher 89% of the time. Three months later, the SPX was up by 7.23%, on average, with an 83% win rate. And six months after a signal, the broad-market barometer gained a whopping 12.18%, on average, and was in the black 89% of the time.
In conclusion, the old adage "Stocks climb a wall of worry" has rung true in the past, as evidenced by the SPX returns after quick-and-dirty drops in active investment manager market exposure. Further, stocks are clearly not in the "euphoria" phase of the sentiment cycle that aligns with market tops -- the CNN Money Fear & Greed Index, in fact, has rarely been lower -- which has bullish implications, from a contrarian standpoint.
