Black Friday Sale! Save huge on InvestingProGet up to 60% off

Semiconductors Send Out Warning Signs

Published 12/21/2017, 11:57 PM
Updated 07/09/2023, 06:31 AM
SOX
-
SMH
-

Semiconductors have led this market for almost two years. The upside move on the semiconductor ETF VanEck Vectors Semiconductor (NYSE:SMH) has been insane. However, in recent weeks something major has changed. The semis have rolled sharply, even as the stock market makes new all-time highs. This should be a big warning sign not just for the semis but for the entire market.

While end of year window dressing and light volume may keep the markets at all-time highs, it is likely there is trouble brewing in early 2018. In addition, the semiconductor index has a classic bear flag formation and is unable to get back over the daily 50 moving average. I have it penciled in that the semiconductor ETF SMH will see another big leg down in the first quarter of 2018, hitting $89.75. This is another 10% drop in the index. For investors, just simply compare the chart of the semis from before the start of 2016 to November 2017. Then compare and see the divergence in December. It is shocking. Note the chart below.

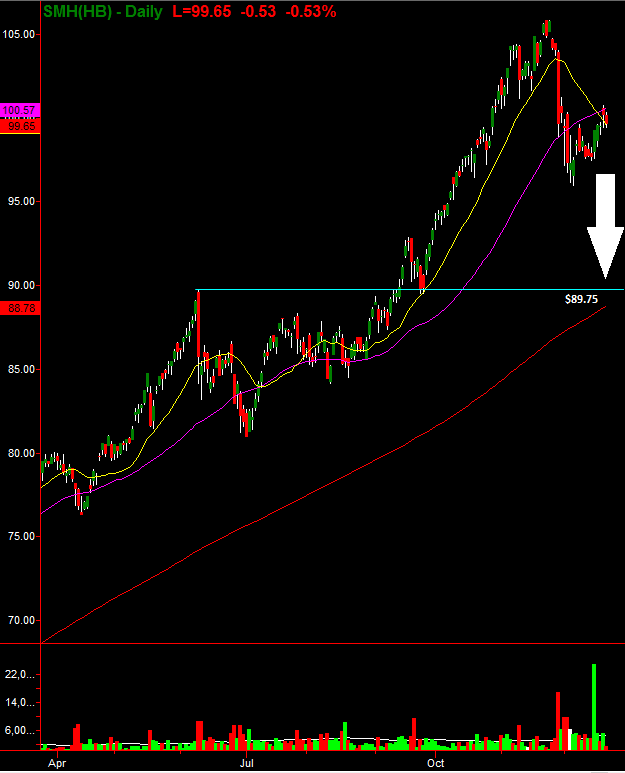
SMH Daily Chart

Latest comments

Loading next article…
Risk Disclosure: Trading in financial instruments and/or cryptocurrencies involves high risks including the risk of losing some, or all, of your investment amount, and may not be suitable for all investors. Prices of cryptocurrencies are extremely volatile and may be affected by external factors such as financial, regulatory or political events. Trading on margin increases the financial risks.
Before deciding to trade in financial instrument or cryptocurrencies you should be fully informed of the risks and costs associated with trading the financial markets, carefully consider your investment objectives, level of experience, and risk appetite, and seek professional advice where needed.
Fusion Media would like to remind you that the data contained in this website is not necessarily real-time nor accurate. The data and prices on the website are not necessarily provided by any market or exchange, but may be provided by market makers, and so prices may not be accurate and may differ from the actual price at any given market, meaning prices are indicative and not appropriate for trading purposes. Fusion Media and any provider of the data contained in this website will not accept liability for any loss or damage as a result of your trading, or your reliance on the information contained within this website.
It is prohibited to use, store, reproduce, display, modify, transmit or distribute the data contained in this website without the explicit prior written permission of Fusion Media and/or the data provider. All intellectual property rights are reserved by the providers and/or the exchange providing the data contained in this website.
Fusion Media may be compensated by the advertisers that appear on the website, based on your interaction with the advertisements or advertisers.
© 2007-2024 - Fusion Media Limited. All Rights Reserved.