🍎 🍕 Less apples, more pizza 🤔 Have you seen Buffett’s portfolio recently?Explore for Free

Semiconductor Reversal Pattern May Spell Trouble For Bulls

Published 12/13/2017, 12:00 PM
Updated 07/09/2023, 06:31 AM
US500
-
SMH
-

Since the 2009 stock-market lows, investors have looked to the Semiconductor sector for strong returns and market leadership.

Just check out its performance vs. the broader stock market: Semiconductor ETF SMH +494% vs S&P 500 +262%.

With numbers that double those of the S&P 500, it’s fair to say that the Semiconductors have provided important leadership for this bull market.

And that leadership has become much more apparent (and “visual”) in the past 18-24 months. Just look at the Semiconductor rally and outperformance! See chart below.
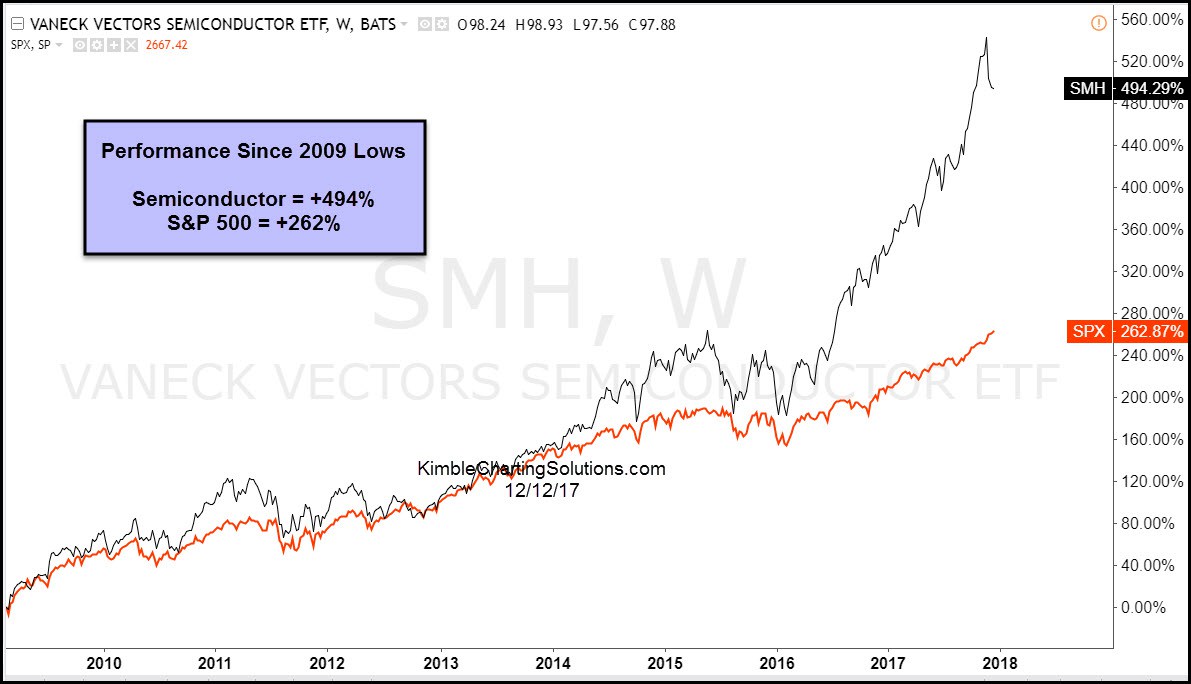
Semiconductor Stocks Vs. Broad Market

If you look closely at the chart above, you’ll note the recent downturn/pullback for SMH. That brings us to the importance of our next chart – a “monthly” bar chart that highlights why the Semiconductors have pulled back here.

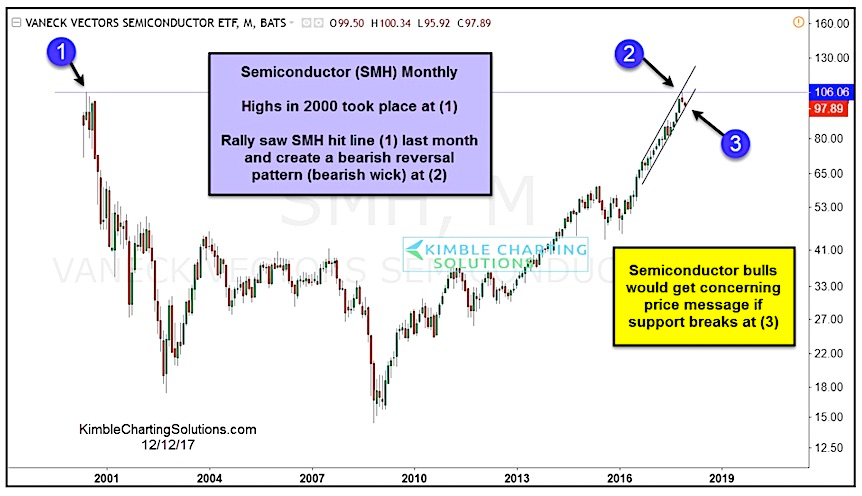
Semiconductors Testing 2000 Highs

SMH recently tested its 2000 price highs (see points 1 & 2 on the chart below), before reversing lower to test uptrend price support (point 3). This action created a bearish reversal pattern and gave market bulls a strong reason to put SMH on their radar.

One thing is certain: Bullish investors don’t want to see this market leader break down! Monthly VanEck Vectors Semiconductor ETF
Latest comments

Loading next article…
Risk Disclosure: Trading in financial instruments and/or cryptocurrencies involves high risks including the risk of losing some, or all, of your investment amount, and may not be suitable for all investors. Prices of cryptocurrencies are extremely volatile and may be affected by external factors such as financial, regulatory or political events. Trading on margin increases the financial risks.
Before deciding to trade in financial instrument or cryptocurrencies you should be fully informed of the risks and costs associated with trading the financial markets, carefully consider your investment objectives, level of experience, and risk appetite, and seek professional advice where needed.
Fusion Media would like to remind you that the data contained in this website is not necessarily real-time nor accurate. The data and prices on the website are not necessarily provided by any market or exchange, but may be provided by market makers, and so prices may not be accurate and may differ from the actual price at any given market, meaning prices are indicative and not appropriate for trading purposes. Fusion Media and any provider of the data contained in this website will not accept liability for any loss or damage as a result of your trading, or your reliance on the information contained within this website.
It is prohibited to use, store, reproduce, display, modify, transmit or distribute the data contained in this website without the explicit prior written permission of Fusion Media and/or the data provider. All intellectual property rights are reserved by the providers and/or the exchange providing the data contained in this website.
Fusion Media may be compensated by the advertisers that appear on the website, based on your interaction with the advertisements or advertisers.
© 2007-2024 - Fusion Media Limited. All Rights Reserved.