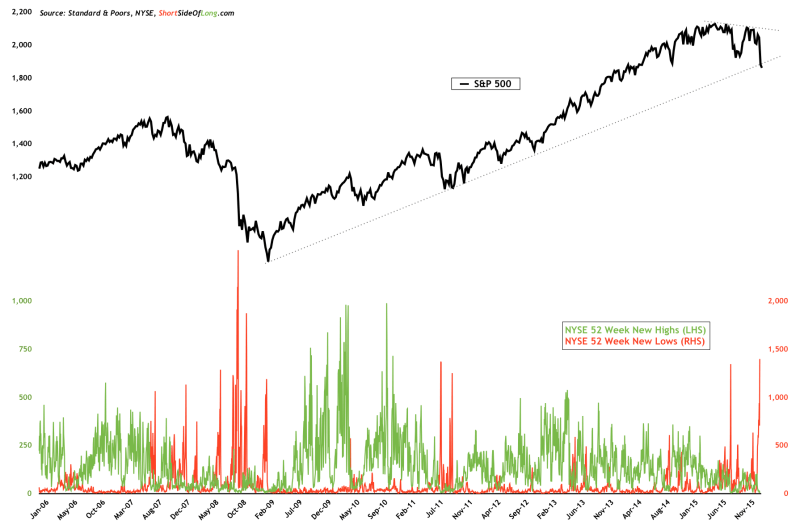
Selling pressure has been quite strong since the beginning of the year. The bearish trend is blamed on oil prices, the slowdown of Chinese economy, Emerging Markets recession, the junk bond sell-off, the Federal Reserve's interest rate hike, tightening liquidity and just about any other negative story you can google. However, as always, I am less interested in the “why” and more interested in what the markets are doing.
Yesterday was quite a strong down day, registering almost 1,400 new lows on the NYSE. Historically, this is a very rare feat.

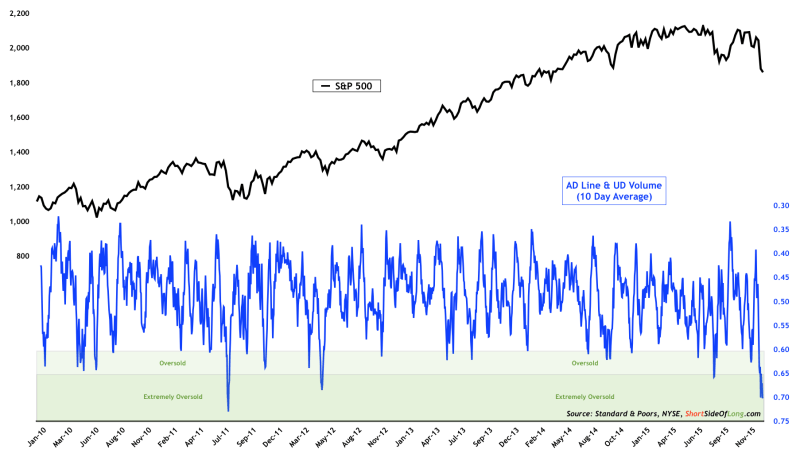
According to SentimenTrader research, during yesterday's sell-off, technical breadth figures showed that “since 1940, only October 19, 1987 and August 8, 2011 will have seen more lopsided Up Volume over 1-day and 10-day periods.” My own chart and data show that, when averaged over the last 10 business days, downside selling pressure approached 70%.
In other words, 70 percent of all issues along with volume have been on the downside. In plain English, we are very much oversold and should expect a relief rally at any point.
Personally, I will be playing the rally for a potential short-term gain, with tight stop-loss risk management. My watchlist includes SPDR S&P 500 (N:SPY), iShares MSCI Emerging Markets ETF (N:EEM), the China H Shares ETF Guggenheim CurrencyShares Chinese Renminbi (N:FXCH) and Energy Select Sector SPDR (N:XLE), all of which are showing incredibly depressed sentiment and extremely oversold breadth readings.

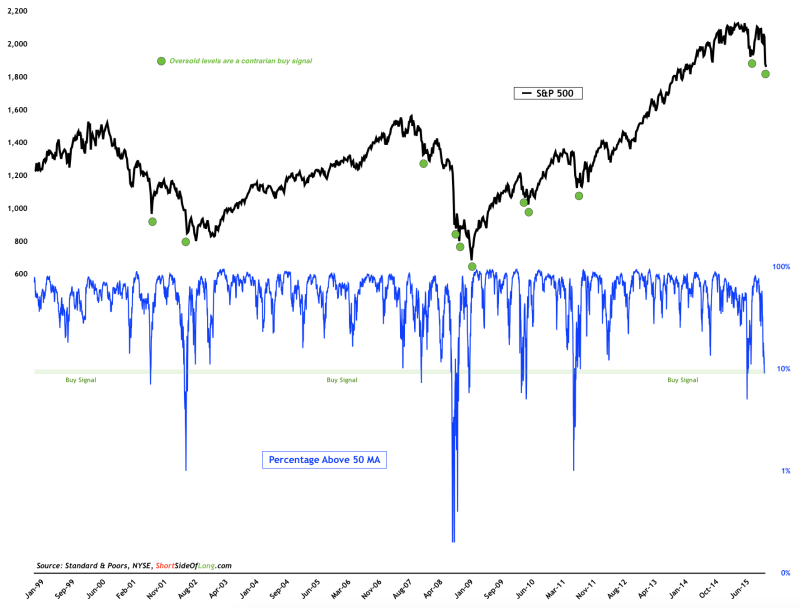
The broad index has given us a rare buy signal, with the percentage of S&P 500 components trading above 50 day moving average falling into single digit territory. Indeed, the current reading of 9% is very low, but I would assume that if we closed near the lows during the last session, this reading would have been closer to 5%.
Contrarian buy signals such as these are not perfect, but do work quite well as can be seen from the chart above. This is only the 11th time in two decades we have a green light to go long (at least for a short term trade), and I am also considering SPY for a potential rebound bet.

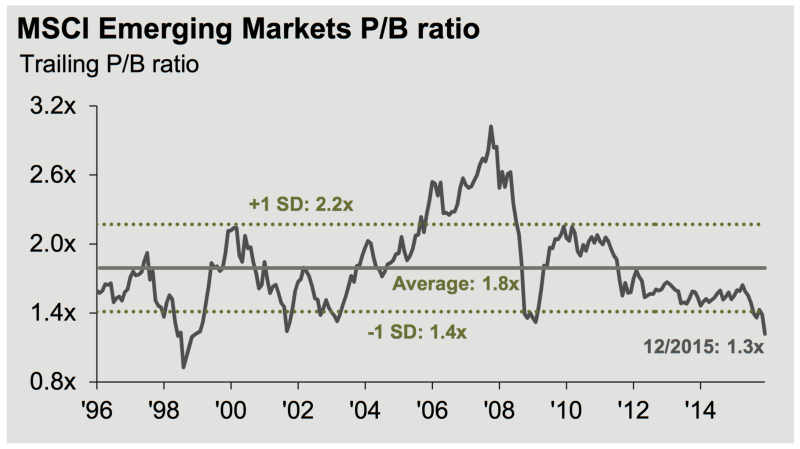
Moving away from the short term perspective, constant selling pressure is creating deep value in various assets such as Emerging Market equities. Coming into 2016, on the 01st of January, the price-to-book valuation was 1.3 times, but with losses over the last three weeks, the valuations have fallen dramatically towards 1.05 times book value. Please note that this is almost on par with the 1998 Asian Financial Crisis.
Of course, I do not know on which day the final bottom will occur. There is definitely a possibility that once we work off oversold conditions, markets will resume lower into a full blown bear market. However when the selling pressure does end, I feel it is assets such as the MSCI Emerging Markets Index (in particular Chinese stocks) that have the greatest upside potential.
