Weekly Trend Model signal
- Trend Model signal: Risk-on
- Direction of last change: Positive
The real-time (not back-tested) buy and sell signals of the Trend Model are shown in the chart below: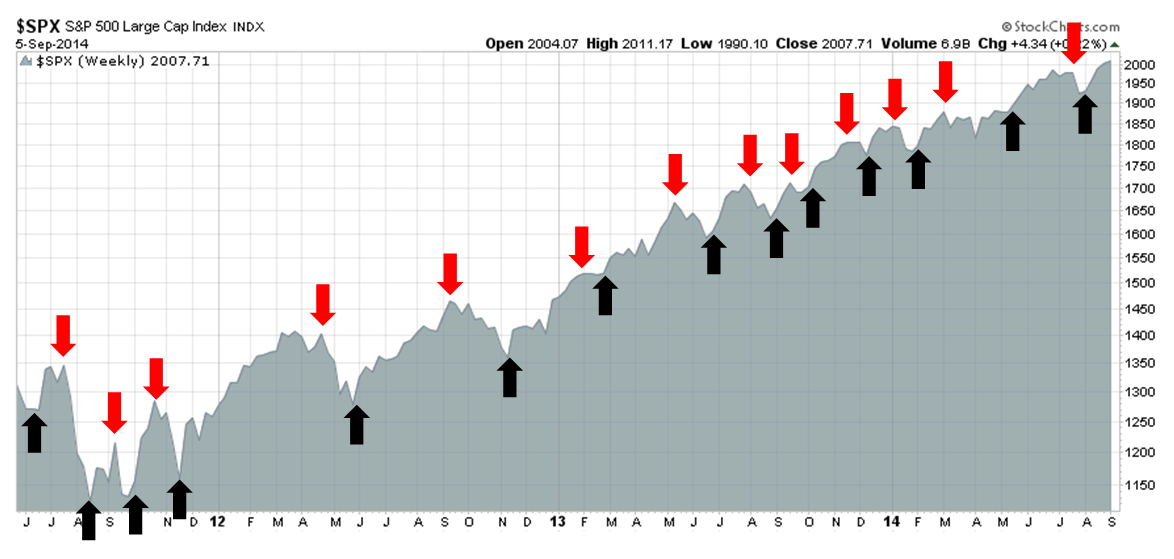
Bullish uptrend
Despite the sideways pattern shown by the SPX last week, the index ended the week at another new high, affirming the uptrend identified on August 10 (see A tradable bottom?). In the past week, technical price momentum has been broadly improving. US equities have edged to a new high; European markets surged on news of the ECB stimulus that dare not speak its name; and commodities have been mixed, with positive performance from industrial metals offset by weakness in energy.
Another bullish sign comes from the positive momentum shown by Street earnings expectations, which is a key fundamental driver of equity returns. I have long written about analysis from Ed Yardeni, whose work has shown a steady improvement in forward 12 month EPS estimates.
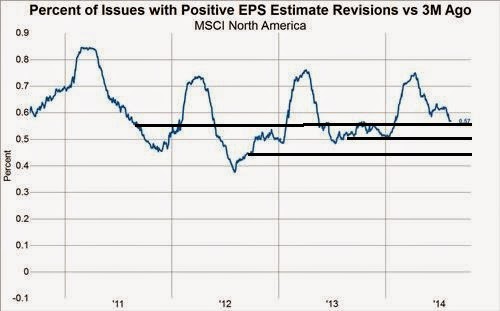
For a different perspective, this chart from Gavekal, of the evolution of North American FY2014 EPS estimates shows that the US earnings outlook has been better than in previous years. There is a seasonality effect to Street earnings estimates, as they usually start the year too high and then decline into year-end. I have drawn black horizontal lines showing where market expectations were at this time in the past three years. As the chart shows, current readings are at the top of the range relative to recent experience:
In other good news, the latest Beige Book survey shows that all regions are showing signs of expansion, indicating a steadily improving economy:
The U.S. economy strengthened in all regions of the country in July and August, in areas including consumer spending, auto sales and tourism, the Federal Reserve reported in a survey released yesterday.
All 12 of the Fed’s regions reported growth. Six — New York, Cleveland, Chicago, Minneapolis, Dallas and San Francisco — characterized growth as “moderate.” The other regions reported somewhat slower expansion. Four described growth as “modest,” and two noted signs of improvement.
What`s more, the economy seems to be in a “not too hot, not too cold“ expansion phase that would prompt the Fed to start worrying about inflationary pressures:
The survey found no clear evidence that the economy is expanding so fast that the Fed might soon begin raising interest rates to prevent inflation.
The disappointing August employment report prompted the WSJ's Jon "Fedwire" Hilsenrath to write, Jobs Report Leaves Fed in No Hurry To Alter Views on Slack or Rates (emphasis added):
When Fed officials said in their July policy statement that they saw “significant underutilization of labor resources” – a signal of continued low interest rates – they were looking at an unemployment rate in June of 6.1%. The rate rose a notch to 6.2% in July and returned in August to 6.1%, the Labor Department said Friday.
The fact that unemployment hasn’t fallen since the July meeting —and that job growth slowed in August— suggests Fed officials won’t make big changes to their policy statement and the signal they’re sending about rates when they meet Sept. 16 and 17.
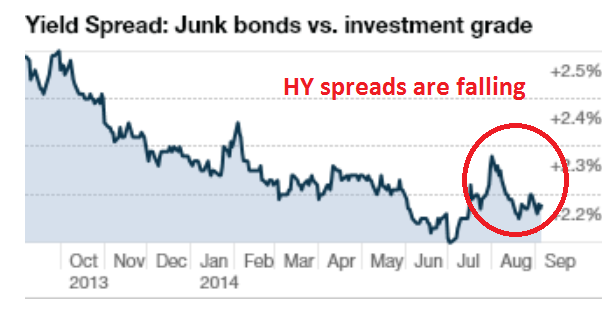
In addition, risk appetite appears to be healthy after a brief scare in late July. As the chart below shows, junk bond spreads are falling again, indicating a rising appetite for risk.
Faltering technical momentum
While the intermediate term picture remains positive, what bothers me is that the tailwind provided by the positive price momentum of the oversold rally from August 10 is starting to lose steam. In addition, the intermediate term trend indicator's market views parallels the "steady as she goes" bullish views of the 10 strategists interviewed by Barron`s. That makes me somewhat uneasy as that outlook is the consensus view.
None of the group, whom we survey each September and December, is bearish these days, although some strategists have toned down their optimism because of the market's gains. Still, the most bullish see the benchmark barreling toward 2500 in the next 18 to 24 months. That would be an increase of nearly 25% from last week's close.
Earnings drive stock performance, and the outlook is relatively rosy here, too. Our 10 savants expect SP 500 earnings to rise 7% in 2014, to a mean $117.83, after advancing 5.7% in 2013. They look for earnings growth to accelerate to 8.1% in 2015, for a total of $127.34. Industry analysts' forecasts, as usual, are even more upbeat than those of the big-picture crowd, at $119.31 for this year and $133.49 for next, according to Yardeni Research.
To explain my concerns about the possible loss of momentum, let's review some of the short-term technical and sentiment indicators in my August 10 post that identified the bottom (see A tradable bottom?, above).
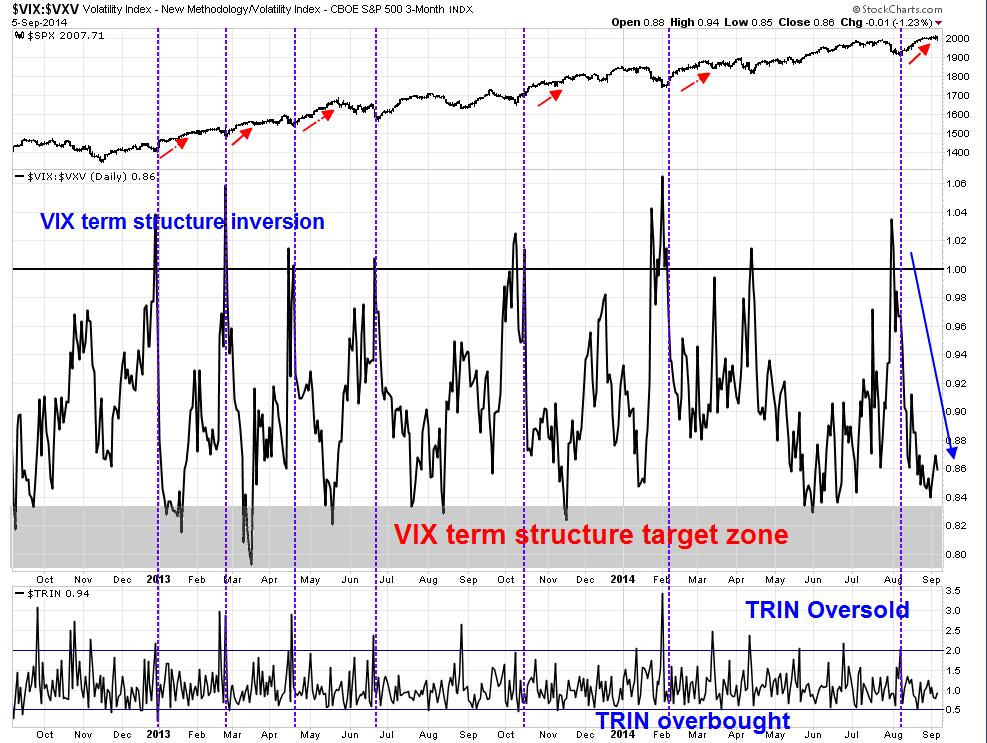
For instance, I wrote about the combination of VIX term structure inversion and TRIN moving above 2 as a powerful tool for spotting previous bottoms (shown by the dotted vertical lines) in the chart below. As the rally from August 10 progressed, note how the VIX-VXV ratio (middle panel) is getting very close to the shaded target zone indicating excessive complacency. We are not quite there yet, but we are getting close.
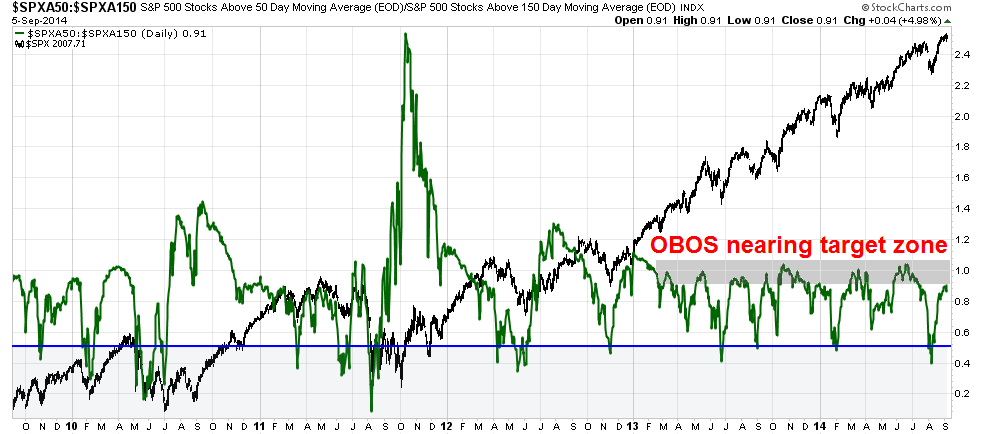
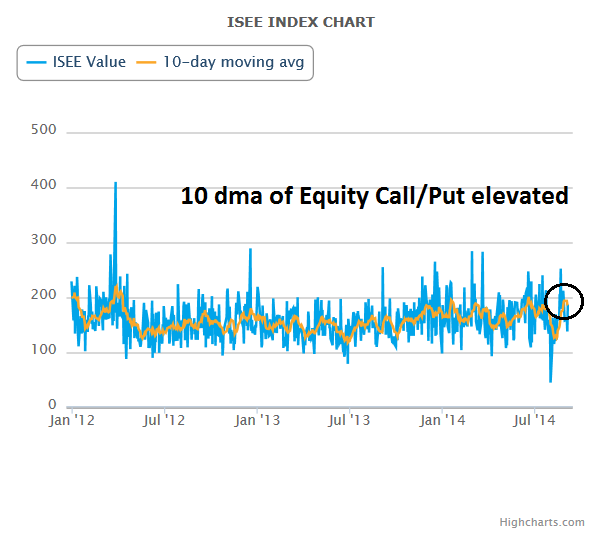
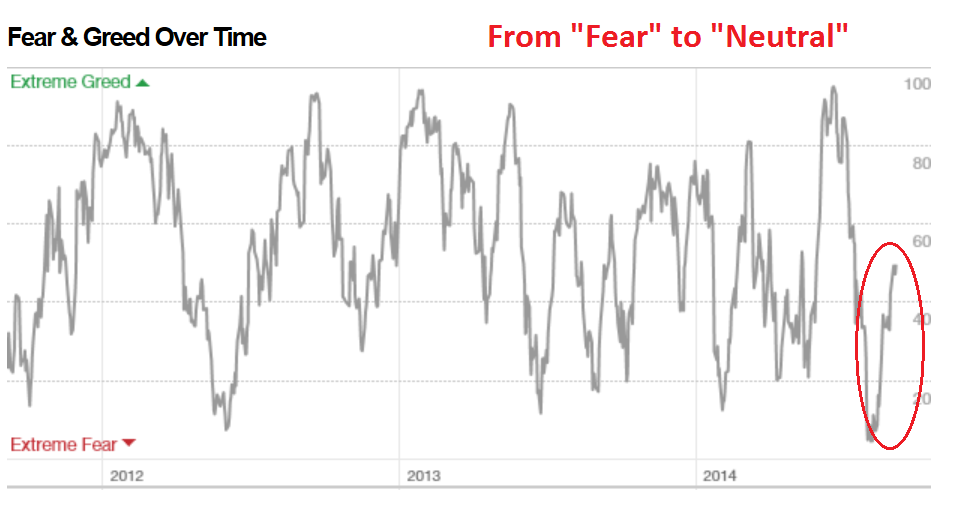
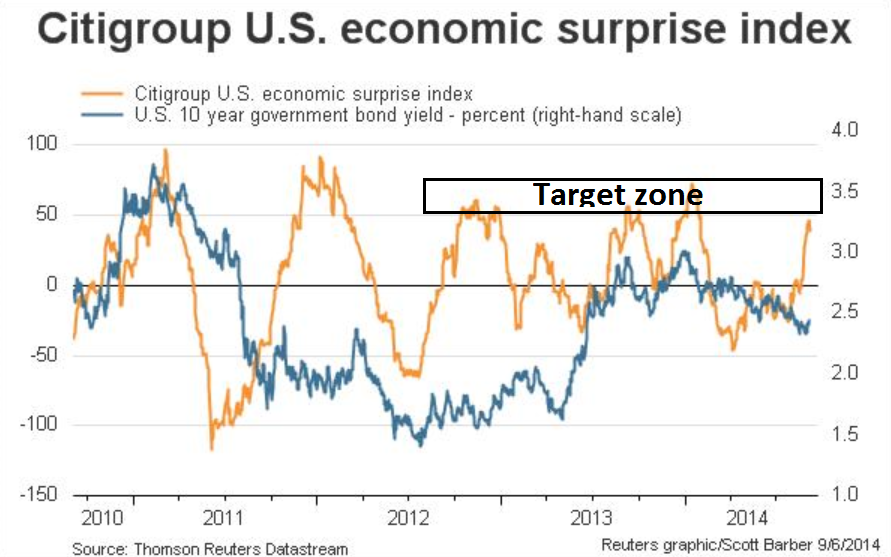
As well, I wrote about my favorite overbought-oversold indicator (in green), which also flashed a buy signal August 10. Like the VIX-VXV ratio, that OBOS indicator is also nearing its target zone.
Right now, the Atlanta Fed's Q3 GDPNow estimate is 3.6%. What if, as the Fat Pitch suggests, trend growth reverts to 2% real after a snap-back from a disappointing winter in Q1?
In May we started a recurring monthly review of all the main economic data (prior posts are here).
Our key message has so far been that (a) growth is positive but modest, in the range of ~4% (nominal), and; (b) current growth is lower than in prior periods of economic expansion and a return to 1980s or 1990s style growth does not appear likely. This is germane to equity markets in that macro growth drives corporate revenue and profit expansion and valuation levels.
This post updates the story with the latest data from the past month.
The overall message remains largely the same. Employment is growing at less than 2%, inflation and wages are growing around 2% and most measures of demand are growing at roughly 2% (real). None of these has seen a meaningful and sustained acceleration in the past 2 years. The economy is continuing to repair, slowly, after a major-financial crisis. This was the expected pattern.
A 2% growth rate would be an enormous miss:
With valuations at high levels, the current pace of sales growth is likely to be the limiting factor for equity appreciation. This is important, as the consensus expects earnings to grow at 8% in 2014 and 12% in 2015.
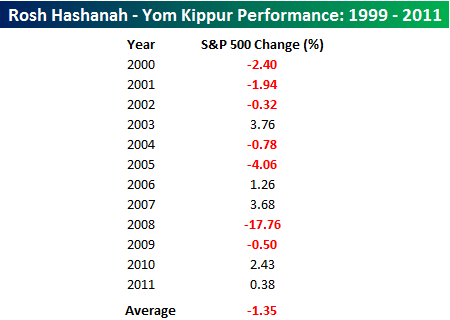
Sell Rosh Hashanah, buy Yom Kippur?
Cam Hui is a portfolio manager at Qwest Investment Fund Management Ltd. ("Qwest"). This article is prepared by Mr. Hui as an outside business activity. As such, Qwest does not review or approve materials presented herein. The opinions and any recommendations expressed in this blog are those of the author and do not reflect the opinions or recommendations of Qwest.
None of the information or opinions expressed in this blog constitutes a solicitation for the purchase or sale of any security or other instrument. Nothing in this article constitutes investment advice and any recommendations that may be contained herein have not been based upon a consideration of the investment objectives, financial situation or particular needs of any specific recipient. Any purchase or sale activity in any securities or other instrument should be based upon your own analysis and conclusions. Past performance is not indicative of future results. Either Qwest or Mr. Hui may hold or control long or short positions in the securities or instruments mentioned.
