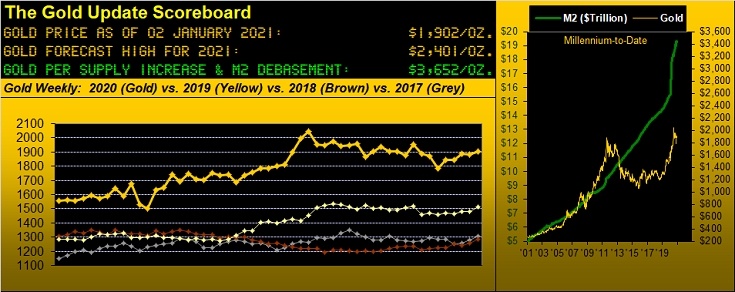
Through all its thrashing machinations, Gold just completed the Second Decade of the 21st Century with a ten-year net gain of +34% from 1422 on Dec. 31 2010 to 1902 on Dec. 31 2020. We now look for Gold in the first year of the Third Decade to reach 2401 for a gain of +26%.
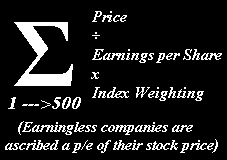
By comparison (for those of you fortunate enough to be scoring at home during this calendar milestone weekend), the US Money Supply (per "M2") finished the decade +119%. And the earning-less stock market index which honestly is horribly due for a massive crash (i.e. the S&P 500) recorded a decade's gain of +199%. Such overly-hedged inflation "mitigant" further compares to 10-year increases in the StateSide Producer Price Index of just +15% and +17% for the Consumer Price Index. The result is our "live" price/earnings ratio of the S&P closing out the decade at 70.5x ... and if you don't believe that, do the math yourself. Here (yet again) is the formula using earnings actually booked:
("Oh my goodness, it's true, it's true!")
So: welcome to the Third Decade of the 21st Century. That's right: 20% of the 21st Century is already gone!
Remember watching "The Jetsons" back in the 60s? Remember Stan Kubrick's "2001"? Been there, done that. Feeling old, are we? Last May marked the 53rd anniversary of the release of "Sgt. Pepper's Lonely Hearts Club Band", since which the price of Gold all told is at present up 53 times. And to quote The Dead from '70: "What a long, strange trip it's been":
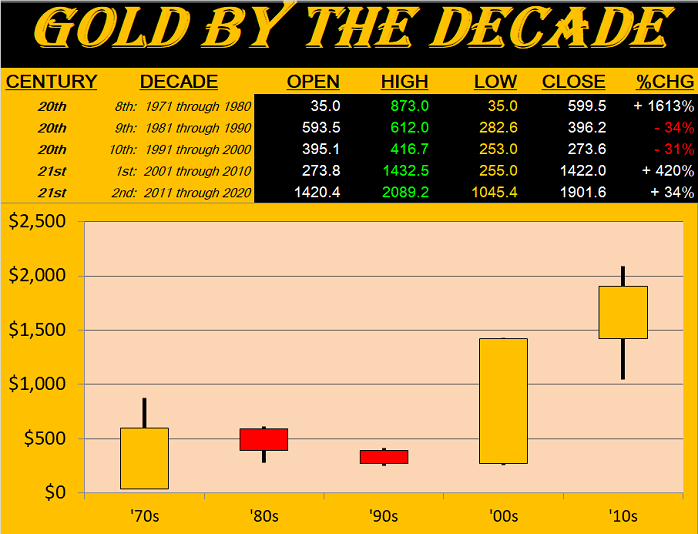
Now let's expand upon our seeing the price of Gold in 2021 reaching 2401, i.e. +26%. Across the 50-year span since Nixon's nixing of the Gold Standard at $35/oz. back in 1971, the yellow metal has recorded 19 down years and 31 up years, including 14 years of gains bettering +20%. And with the currency debasement pedal stomped all the way to the metal, Gold ought be in top gear.
Obviously markets always revert to "their mean", but what do we really mean by "mean"? Per technical analysis, whether one is scrutinizing Gold, or the S&P, or any market, the number of "means" is infinite, given so are the number of studies. Select that which makes the analyst look good, and there it is.
But when it comes to fundamental analysis—at the end of the day—there is one critical "mean" so to speak for the S&P 500: the price of earnings; and one for Gold: the debasement of money. Today, one pays $70 to earn $1 (ex-adjusting for the measly yield of 1.501%) from owning the S&P 500; (historically, paying $20 is "expensive"). There's your crash. Today, one pays $1,900 to own an ounce of Gold worth $3,652 by our opening Scoreboard. There's your stash.
'Tisn't rocket science a bit; rather 'tis common sense which has yet to be drilled into the 95% (some say 98%) of the investing public lacking Gold ownership. Technically, one may duly say that Gold is "overbought", the present price of 1902 being 10% above its 300-day moving average of 1732. Fundamentally, one can duly say that Gold is "underbought" given present price being 48% below our 3652 valuation.
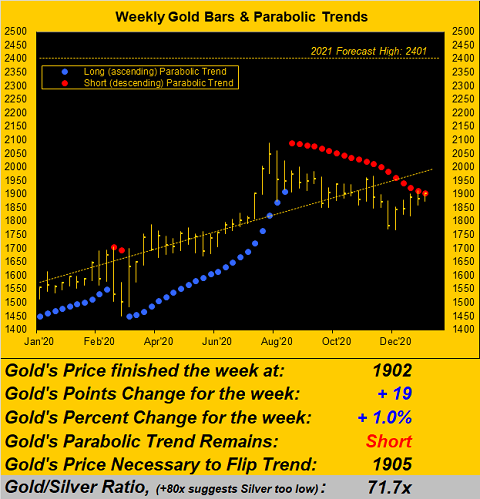
As to specifically selecting a Gold high of 2401 in 2021, projecting price comes in all forms. Soothsayers' tools as noted are infinite. And other than the clearly upside guidance we have from valuing Gold today at 3652, projecting price precisely beyond the All-Time High of 2089 into uncharted territory is tough. We've thus decide to KISS ("Keep It Simple Stupid") by assessing at what level the diagonal trendline in the following chart of Gold's weekly bars shall be if extended a year: which is 2401 at the present slope's rate of increase. And in dipping a toe beyond our pay level for you Fibonacci folks out there, a "Golden Ratio" extension using 2020's low and high projected out to the end of next year also puts price into the 2400s. Bestow a blast of Bidenomics and maybe 2401 seems conservative; (mind that "federal income tax withheld" box on your pay voucher).
As for "The Now", Gold need trade up just three li'l ole points in the New Year's first week to flip the red parabolic Short dots to beautiful blue Long dots. Thus gettin' into Gold early on appears the right thing to do:
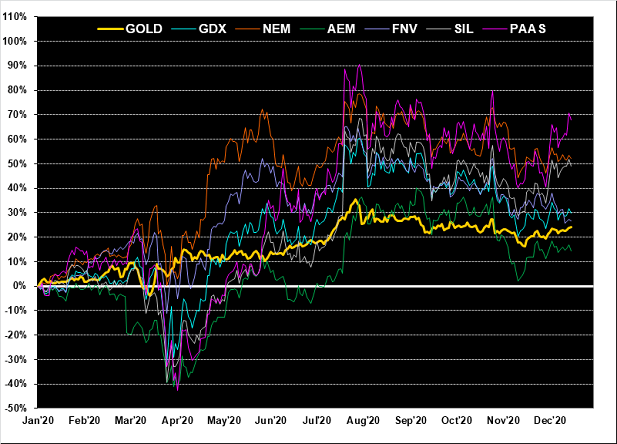
Gold's net gain in 2020 was +25%. And with the exception of Agnico Eagle Mines (NYSE:AEM) +14%, the other key levered equities outperformed with Franco-Nevada Corporation (TSX:FNV) +27%, the VanEck Vectors Gold Miners exchange-traded fund (NYSE:GDX) +30%, the Global X Silver Miners ETF (NYSE:SIL) +49%, Newmont Goldcorp (NYSE:NEM) +52%, and Pan American Silver (NASDAQ:PAAS) +68%:
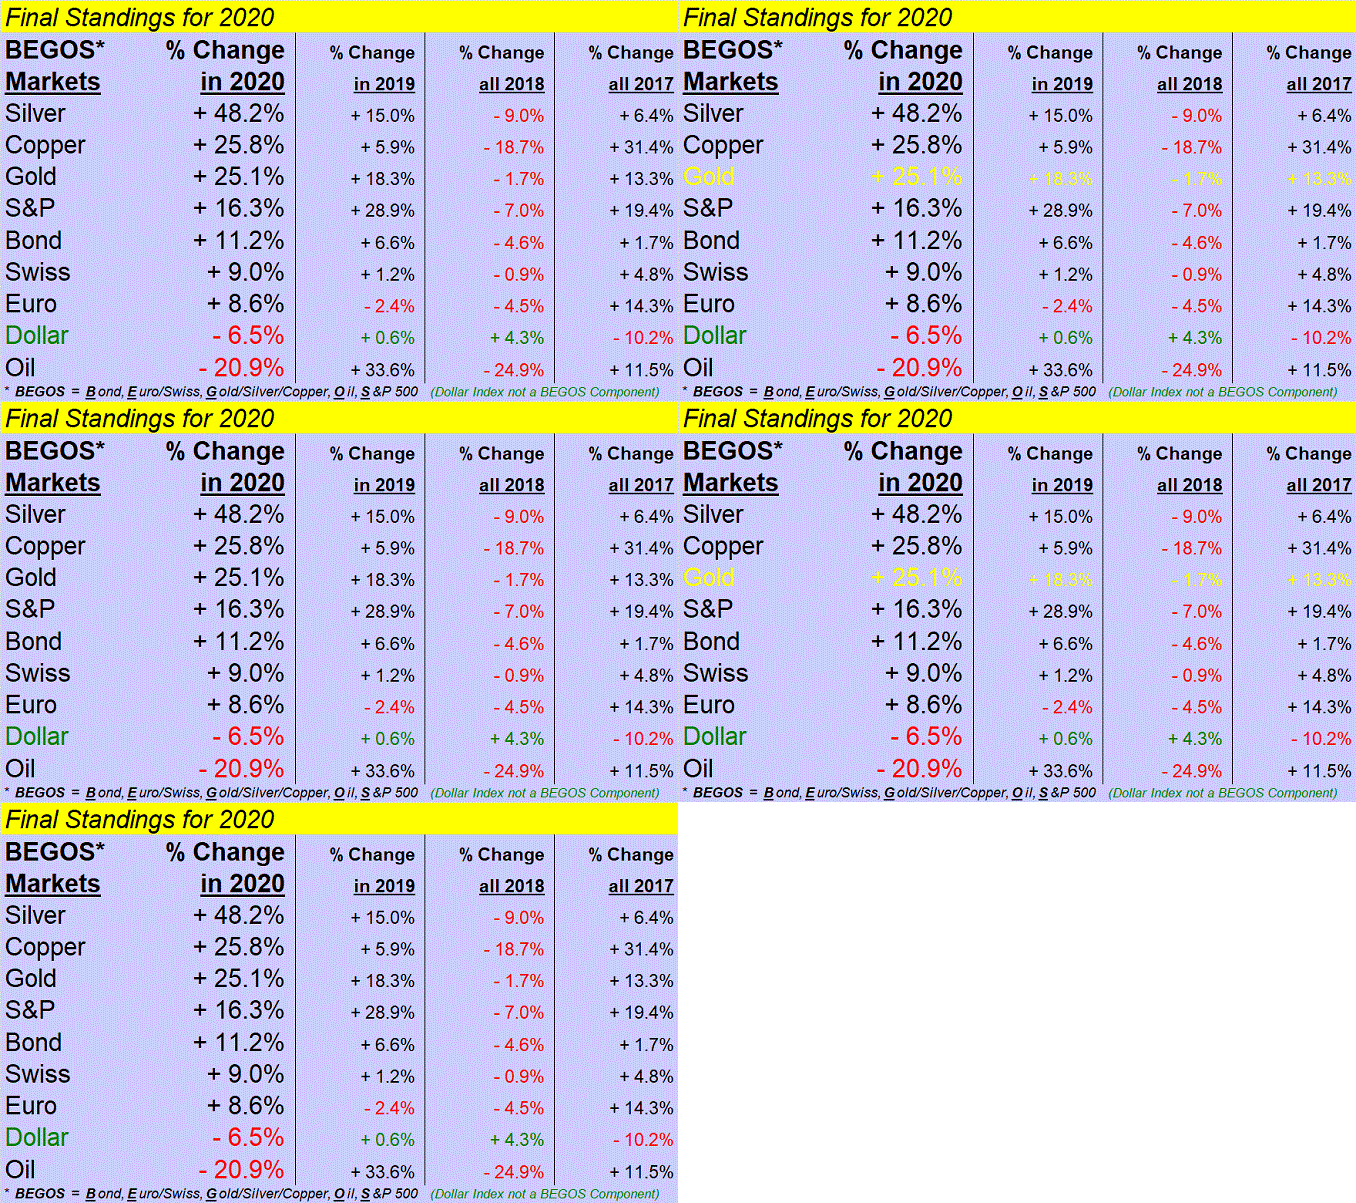
As for the 2020 BEGOS Markets in toto, the Metals Triumvirate took the entire podium with Silver +48%, Copper +26% and Gold +25%. Here are the year's final standings:
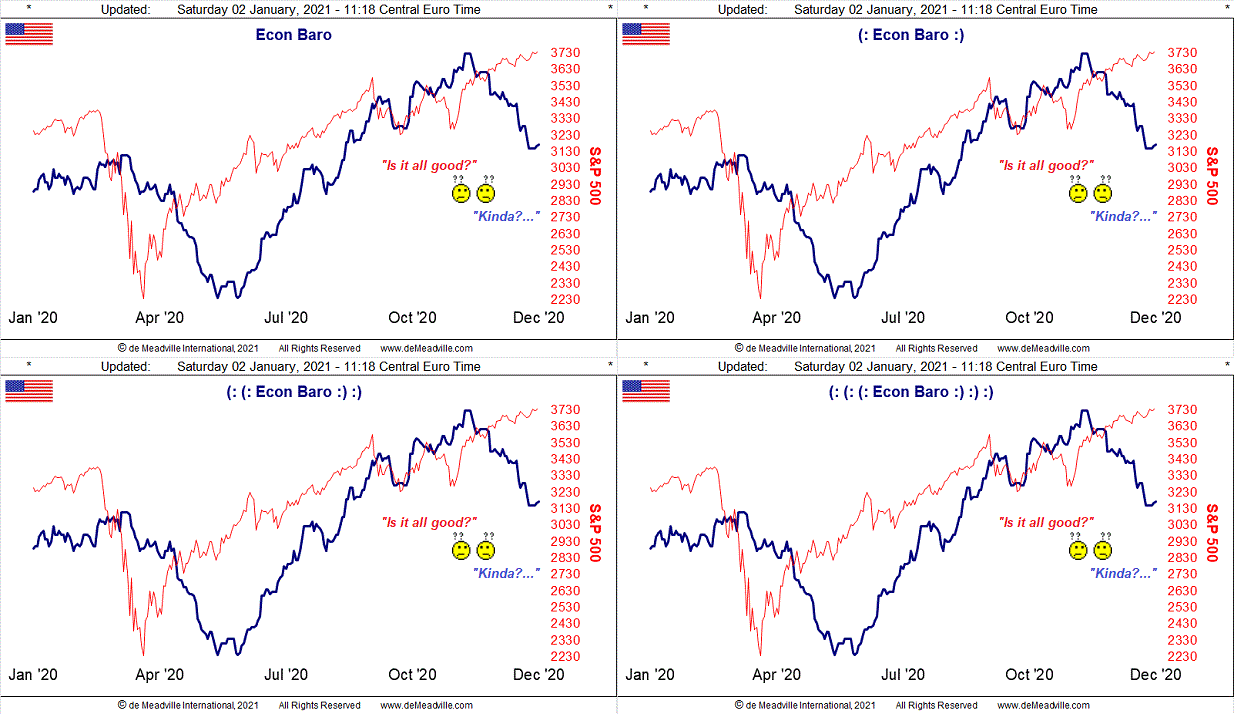
In turning to the Economic Barometer for the entire year, one wonders how 'twould appear had there not been the COVID fear, (or even so, had we not locked down and rather protected those elderly with already serious health issues). StateSide, the economic climb out has nonetheless been surprisingly solid, even as small business sectors and the travel/hospitality industries still swim in dire straits. As a tiny sampling EuroSide, on Wednesday we drove through the lovely town of Bordighera: every business right down the main street seems completely shuttered. If that is representative of the Continent at large, one wonders for how long the European Central Bank can keep from even furthering its own currency's debasement. For 2020, the U.S. "M2" money supply increased +26% (almost in tandem with Gold's +25% increase in price); yet Euro "M2" increased but +10%. Short Euro, Long Gold? Remember: Gold plays no currency favourites ... but can gain favour from a falling Baro:
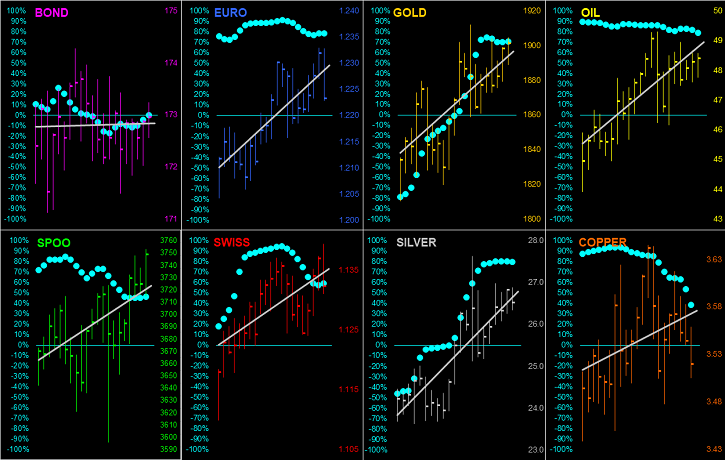
As for the BEGOS Markets' drive into 2020 year-end, we've the final month (21 trading days) replete with each component's "Baby Blues", the dots which depict the consistency of the grey diagonal regression trendlines. And note: none of those trendlines are in decline, which means (as Squire would say were he here), the Dollar is going into the dumper. Indeed the Dollar Index settled out the year at 89.89, its lowest monthly close since March 2018. Thus here's the buoyant BEGOS bunch for December:
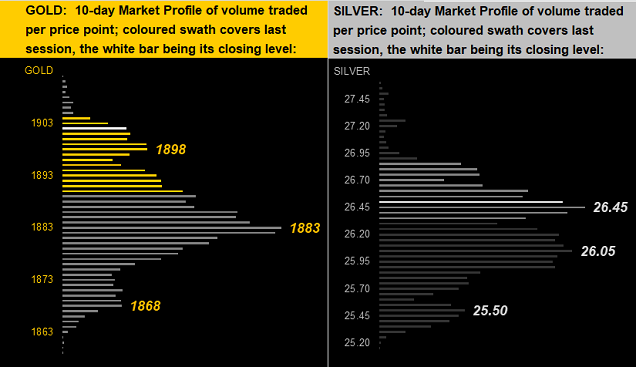
And specific to near-term volume concentration in the precious metals, here we have the 10-day Market Profiles for Gold on the left and for Silver on the right, the most heavily traded price apices as denoted:
To close out the decade with our graphics galore is the Gold Structure chart spanning the last 10 calendar years by price's monthly bars. Clearly the rightmost bar of December 2020 shows a solid up month had by Gold. And with the aforeshown weekly parabolic Short trend on the verge of flipping to Long, we expect January, too, to be another firm up month. (Oh: as for the wee chap that had taken to squatting in this graphic's lower right corner, he finally was "fired", literally):
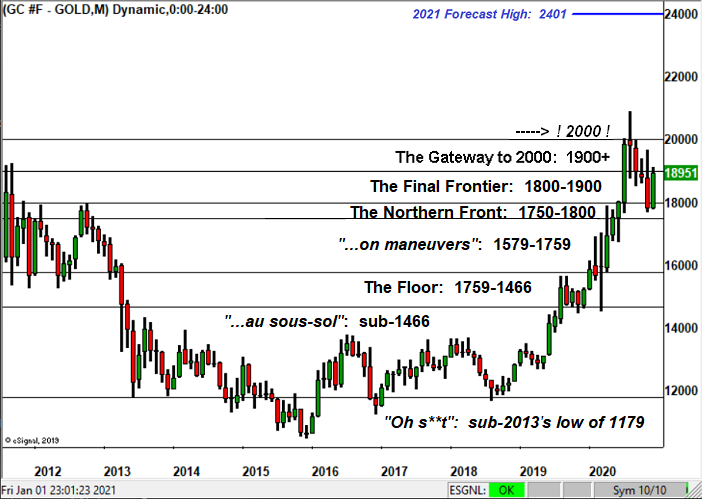
So there's our crawling out on a limb for 2021 in seeking a high for Gold of 2401. As detailed, the technicals might be regarded as overbought, but the fundamentals as more overwhelming positive, and the fuel to get there being Gold becoming less underbought than 'tis!
Happy New Decade to all of our valued readers through every Saturday since The Gold Update commenced on Nov. 14 2009! Here's to Gold threading its way to 2401 in 2021!