NVDA gained a massive 197% since our AI first added it in November - is it time to sell? 🤔Read more

Sector Rotation Sends Technology Stocks Lower And Banks Higher

Published 09/10/2019, 01:33 AM
Updated 09/20/2023, 06:34 AM
US500
-
AAPL
-
FCX
-
CL
-
NFLX
-
NXPI
-
IWM
-
LULU
-
XLE
-
XLF
-
XLK
-
ROKU
-

It was a rather dull day on Monday with the S&P 500 finishing the day flat. However, underneath the surface, there was some sector rotation that was taking place. It sent the financial and energy stocks higher, and technology lower.

Based on the movement in yield and oil, the rotation seems rational and somewhat logical. The big question is if it will last? That part I’m not sure at this point. One day doesn’t make a trend, but I do not happen to think that oil and yields can continue to rise a bit more.

S&P 500 (SPY)
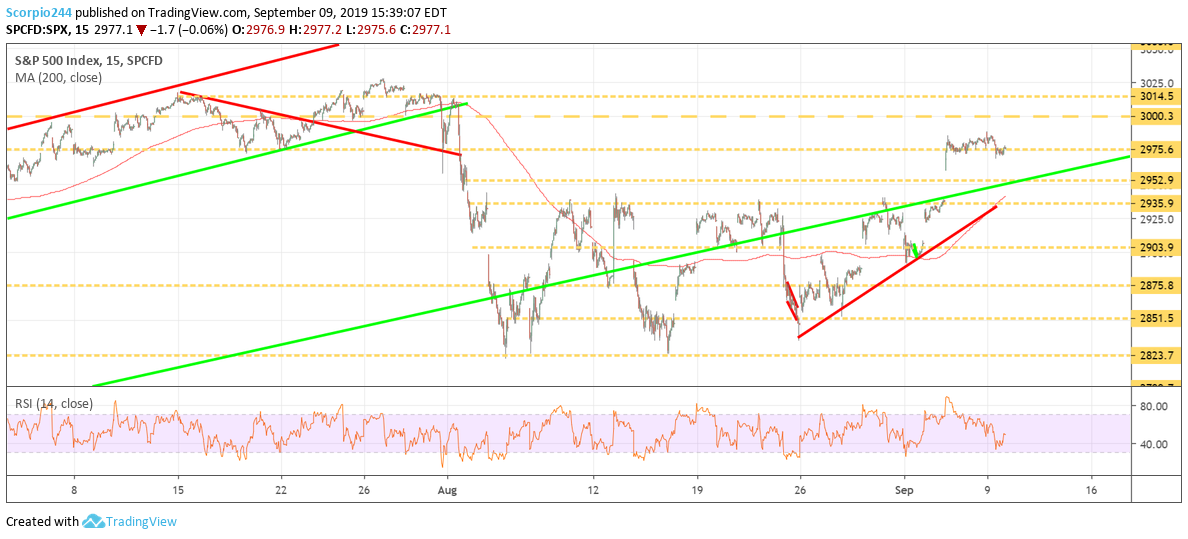
S&P 500 Index

The good news is that the index is holding support around 2975. Nothing in my outlook has changed.

Russell (IWM)
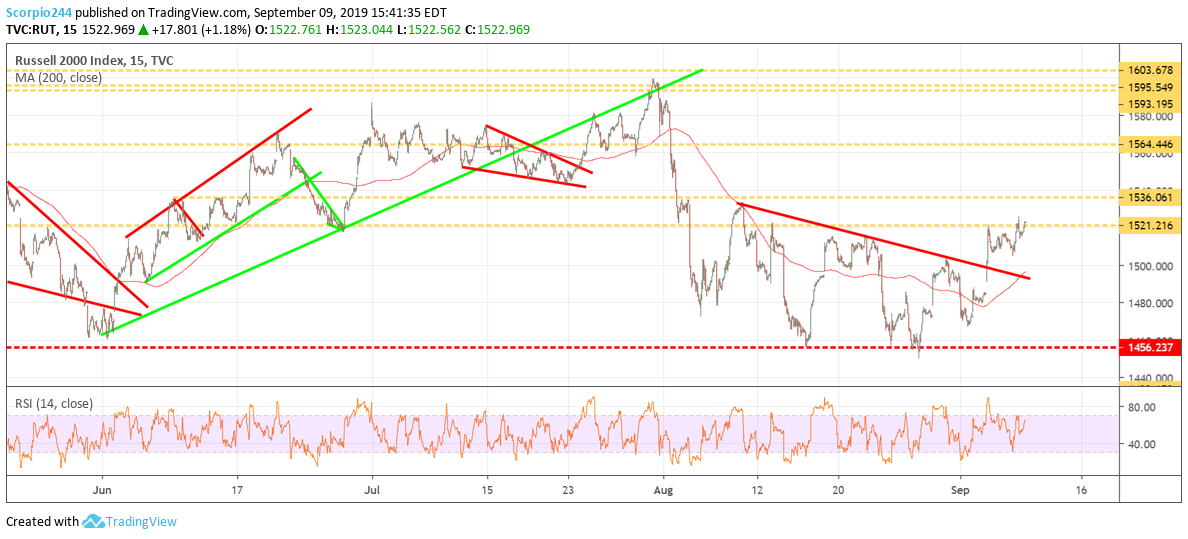
Russell 2000 Index Chart

The Russell had a great day, rising by over 1% today, and is attempting to clear resistance at 1,521. I think that is positive and that 1,536 is likely next.

Roku (ROKU)
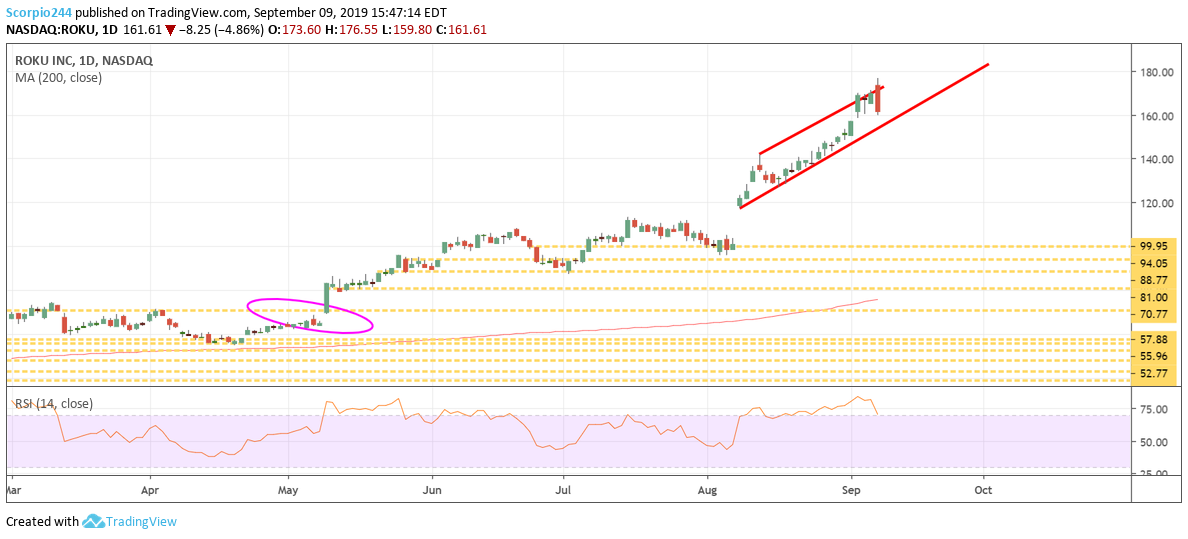
Roku Inc Daily Chart

Is the Roku (NASDAQ:ROKU) bubble popping? It certainly seems possible. The stock’s valuation makes Netflix (NASDAQ:NFLX) look cheap. But at this point, you can see that the uptrend is still intact. However, should the stock drop below $155 then perhaps it sends the $100. But $155 is the level to watch.

Freeport (FCX)

Freeport-McMoran Copper & Gold (NYSE:FCX) jumped today, and the next level to watch for is $9.90.
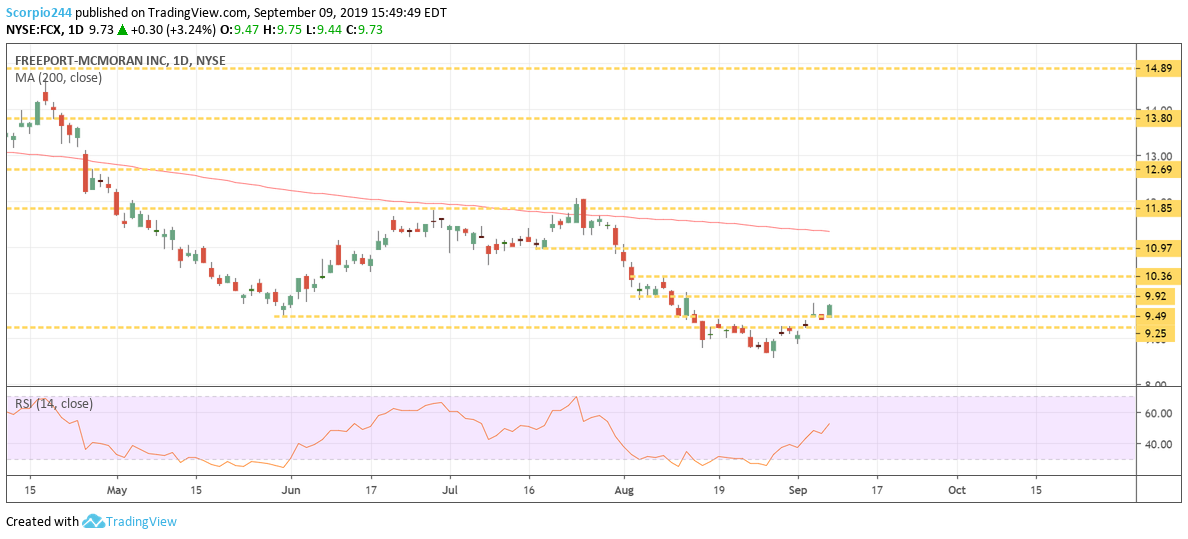
Freeport Inc Daily Chart

Lululemon (LULU)

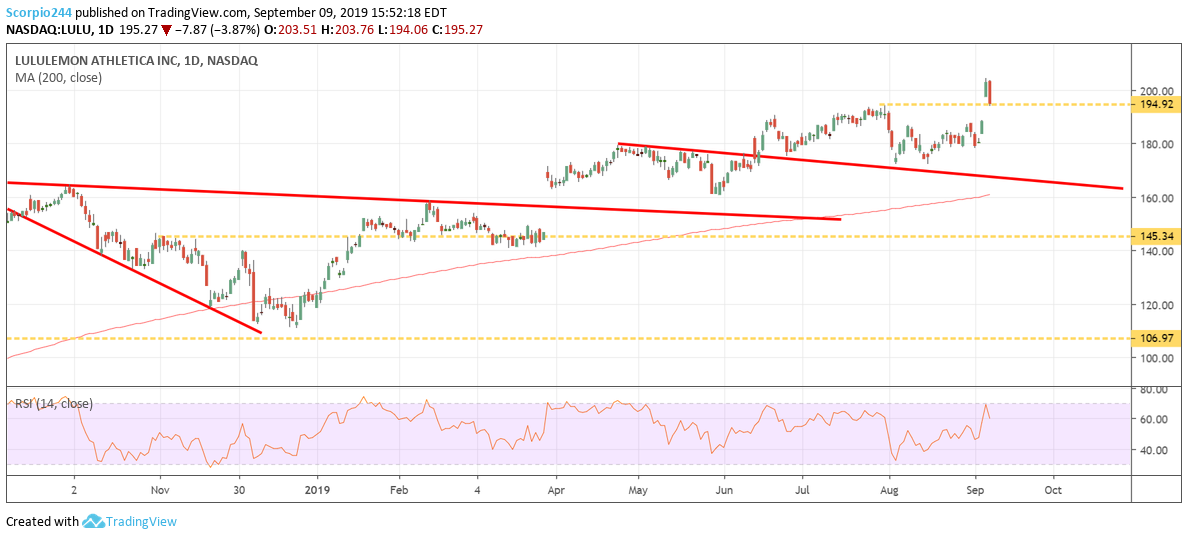
Lululemon Athletica (NASDAQ:LULU) was down today after last week’s significant gains. But for now, it holds support at $195. However, a break of support will send shares towards $189.
Lululemon Inc Daily Chart

Apple (AAPL)

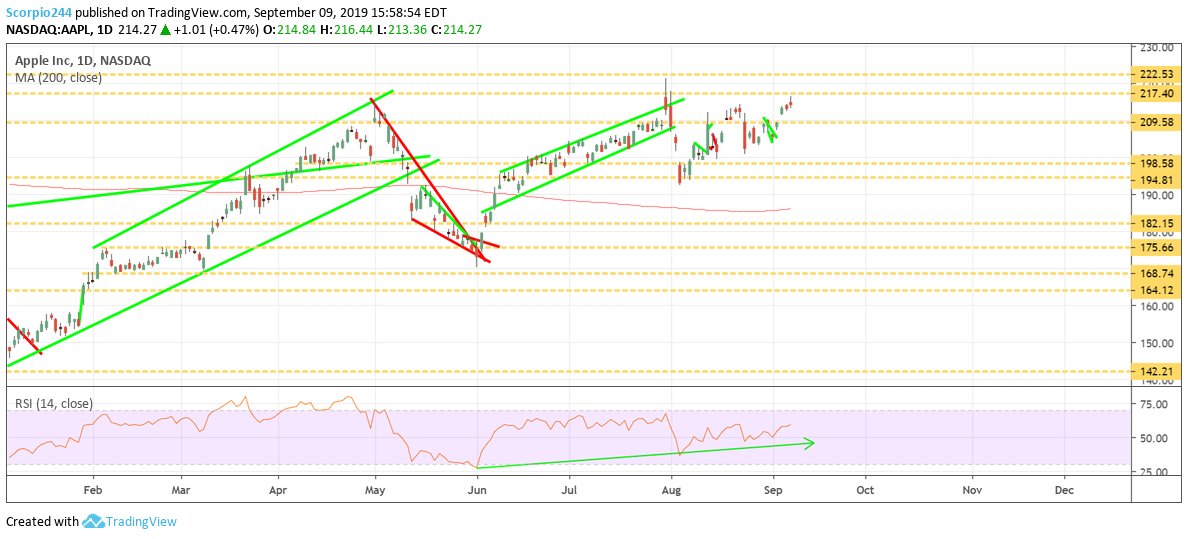
Apple (NASDAQ:AAPL) got close to failed at resistance around $217. I saw bearish options betting in the stock. It has me thinking that perhaps the stocks run may cool some. $209.50 is the next level of support.
Apple Inc Daily Chart

NXP (NXPI)

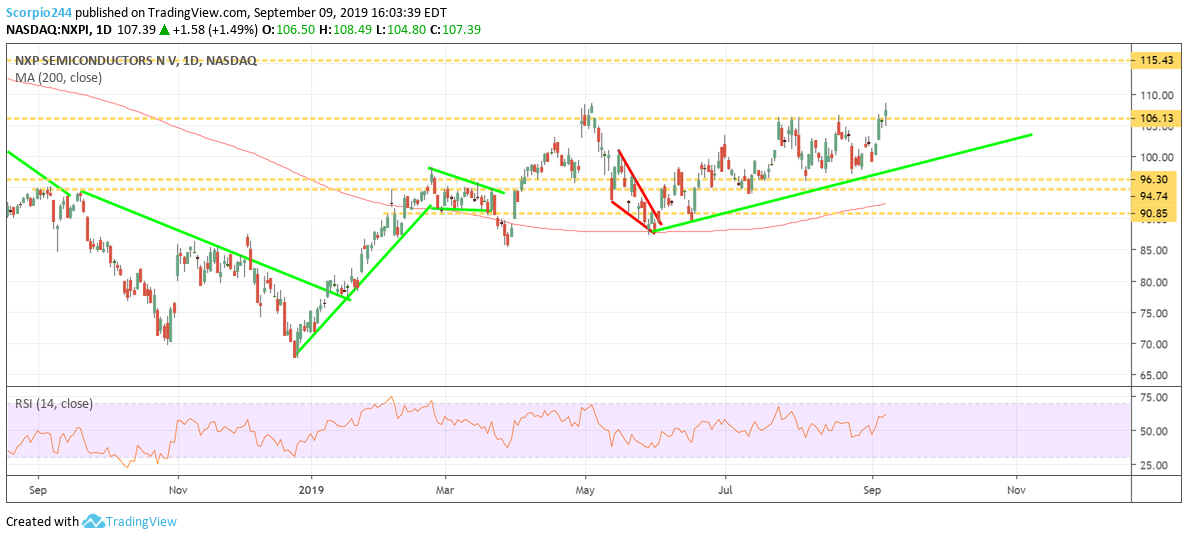
NXP (NASDAQ:NXPI) looks as if it may have broken out rise above $106. We have been waiting for this for some time. But perhaps it finally sticks with a move to $115 possible.
NXPI Daily Chart

Original Post

Latest comments

Loading next article…
Risk Disclosure: Trading in financial instruments and/or cryptocurrencies involves high risks including the risk of losing some, or all, of your investment amount, and may not be suitable for all investors. Prices of cryptocurrencies are extremely volatile and may be affected by external factors such as financial, regulatory or political events. Trading on margin increases the financial risks.
Before deciding to trade in financial instrument or cryptocurrencies you should be fully informed of the risks and costs associated with trading the financial markets, carefully consider your investment objectives, level of experience, and risk appetite, and seek professional advice where needed.
Fusion Media would like to remind you that the data contained in this website is not necessarily real-time nor accurate. The data and prices on the website are not necessarily provided by any market or exchange, but may be provided by market makers, and so prices may not be accurate and may differ from the actual price at any given market, meaning prices are indicative and not appropriate for trading purposes. Fusion Media and any provider of the data contained in this website will not accept liability for any loss or damage as a result of your trading, or your reliance on the information contained within this website.
It is prohibited to use, store, reproduce, display, modify, transmit or distribute the data contained in this website without the explicit prior written permission of Fusion Media and/or the data provider. All intellectual property rights are reserved by the providers and/or the exchange providing the data contained in this website.
Fusion Media may be compensated by the advertisers that appear on the website, based on your interaction with the advertisements or advertisers.
© 2007-2024 - Fusion Media Limited. All Rights Reserved.