Summary
The weekly and three-month performance chart shows a more defensive orientation.
The foundations of the tech sector rally are starting to fade.
We have a late-cycle situation.
As always, let's begin with a look at a table showing the weekly performance of the nine major ETFs during the last week:

The Health Care and Consumer Staples ETFs were the top two performing ETFs. The Utilities ETF was the third best performer, rounding out the distinctly conservative list of weekly top performers. The Energy ETF was the worst performer thanks to a mild drop in oil's price. Industrials were off marginally as they continue their tariff-induced struggle.

The one-month performance table is a bit more aggressive, with Financials and industrials coming in at number two and three on the top performer's list. But health care was still the top performer, rising a little over 7%. And consumer staples was number four, advancing a still healthy 5.73%.

And the three-month table again shows that the health care and consumer staples are the best performers. Technology and Consumer Discretionary -- two more aggressive sectors -- rank three and four.
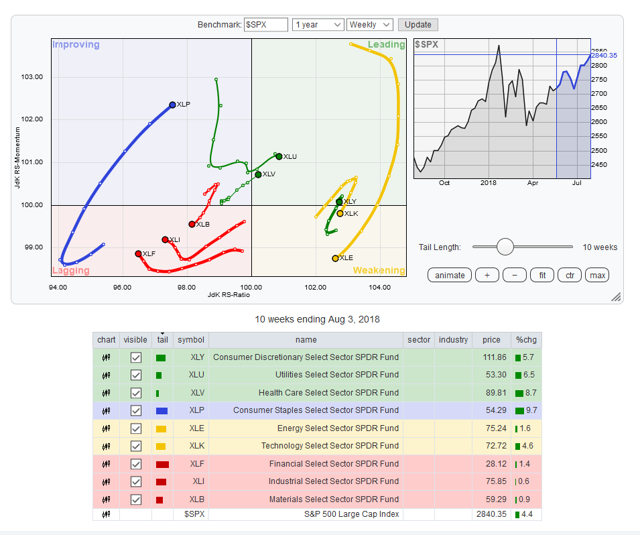
The relative strength graph brings this out as well:
Utilities and health care are now leading the SPDR S&P 500 (NYSE:SPY); consumer staples are improving. Technology and energy are weakening and consumer discretionary is barely hanging on.
So -- what's happening? This is a standard late-bull market performance chart. When a rally starts to get old, traders take profits in the stocks that have outperformed (such as tech) and shift profits to slower-growing but more stable companies like staples and health care. We've already started to see this happen.
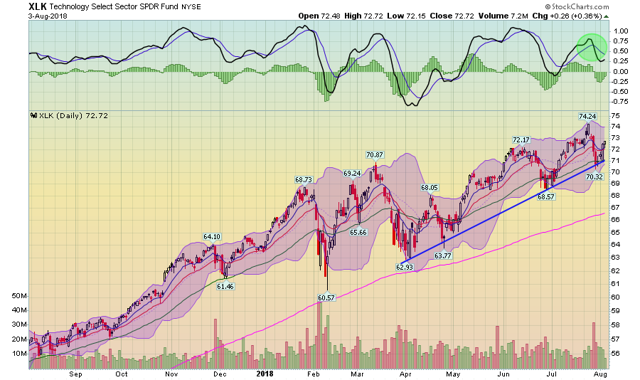
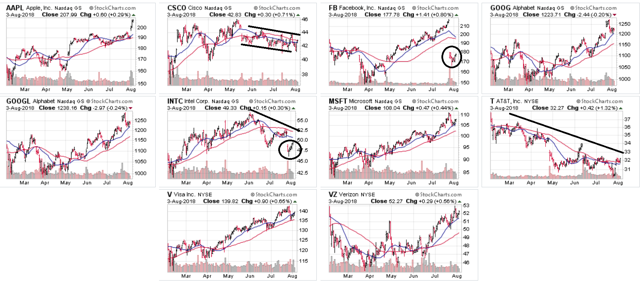
The tech ETF is still in an uptrend. But momentum (the MACD on top) is weaker. And we're starting to see a breakdown in several charts of its biggest members:
Cisco Systems Inc (NASDAQ:CSCO) (top chart, second from the left), Facebook (NASDAQ:FB) (top chart, second from the right), Intel (NASDAQ:INTC) (middle chart, second from the left) and AT&T (NYSE:T) (middle chart, far right) are weakening.
And two of the FAANGS are down:
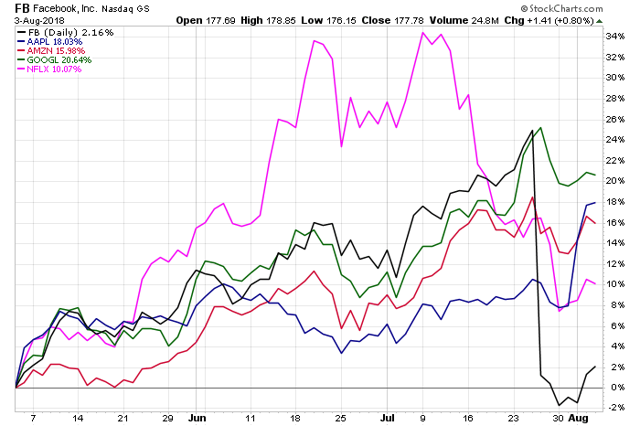
Google (NASDAQ:GOOGL) (in green), Amazon (NASDAQ:AMZN) (in red), and Apple (NASDAQ:AAPL) (in blue) are doing fine. But Netflix (NASDAQ:NFLX) (in magenta) and Facebook (in black) have taken some pretty sharp hits.
In contrast, we have the XLV and XKP charts:
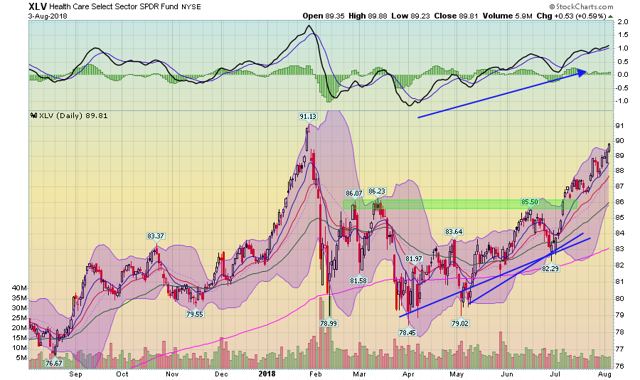
The XLV has risen from the upper 70s to the upper 80s since the beginning of April. And their rise is characterized by two steps: the first lasted three months and is a moderate increase while the second, which occurred over July, is a far stronger rally.
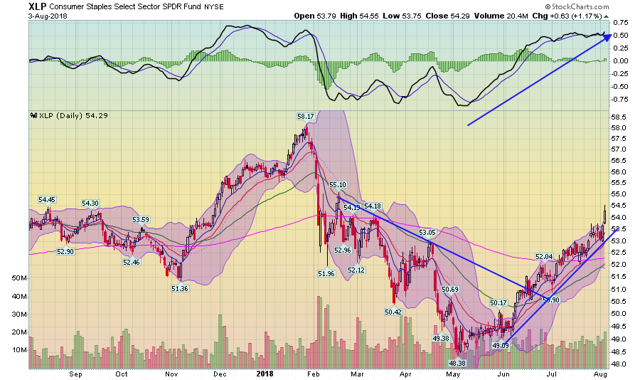
The consumer staples sector is in a strong advance. It has risen from the upper 40s to the mid-50s in two months. Prices are now above the 200-day EMA and the shorter EMAs rising. The 10 and 20-day EMA are over the 200-day EMA as a well.
And the advance-decline lines of both sectors are rising as well:
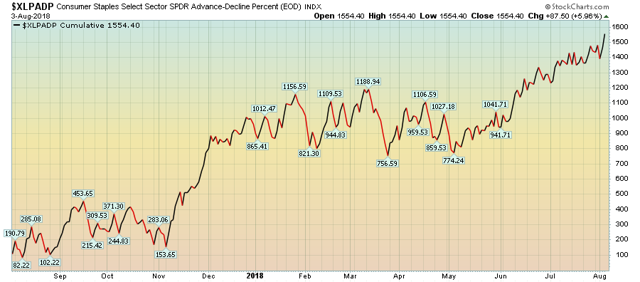
The XLPs line has been increasing over the last two months, as has the
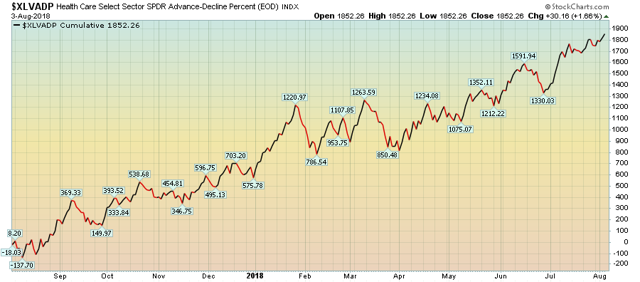
healthcare sectors.
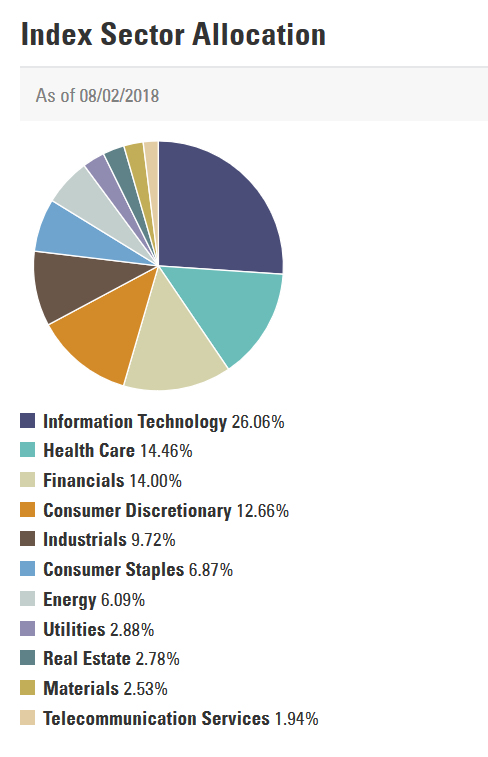
Technology comprises 26% of the SPYs. In comparison, health care and consumer staples combined make-up 21.33 % of the bigger index. That means both sectors must work slightly harder at the same time to hold of the SPYs value. And this is while technology (read: the FAANGs) is taking a bit of a hit. This goes a long way to explaining why the SPYs have had a difficult time retaking their old highs despite a strong economy and great earnings season.
Disclosure: I/we have no positions in any stocks mentioned, and no plans to initiate any positions within the next 72 hours.
I wrote this article myself, and it expresses my own opinions. I am not receiving compensation for it (other than from Seeking Alpha). I have no business relationship with any company whose stock is mentioned in this article.

