Summary
This was a very negative week for the major sectors.
We're seeing weak performance in the one- and three-month sectors.
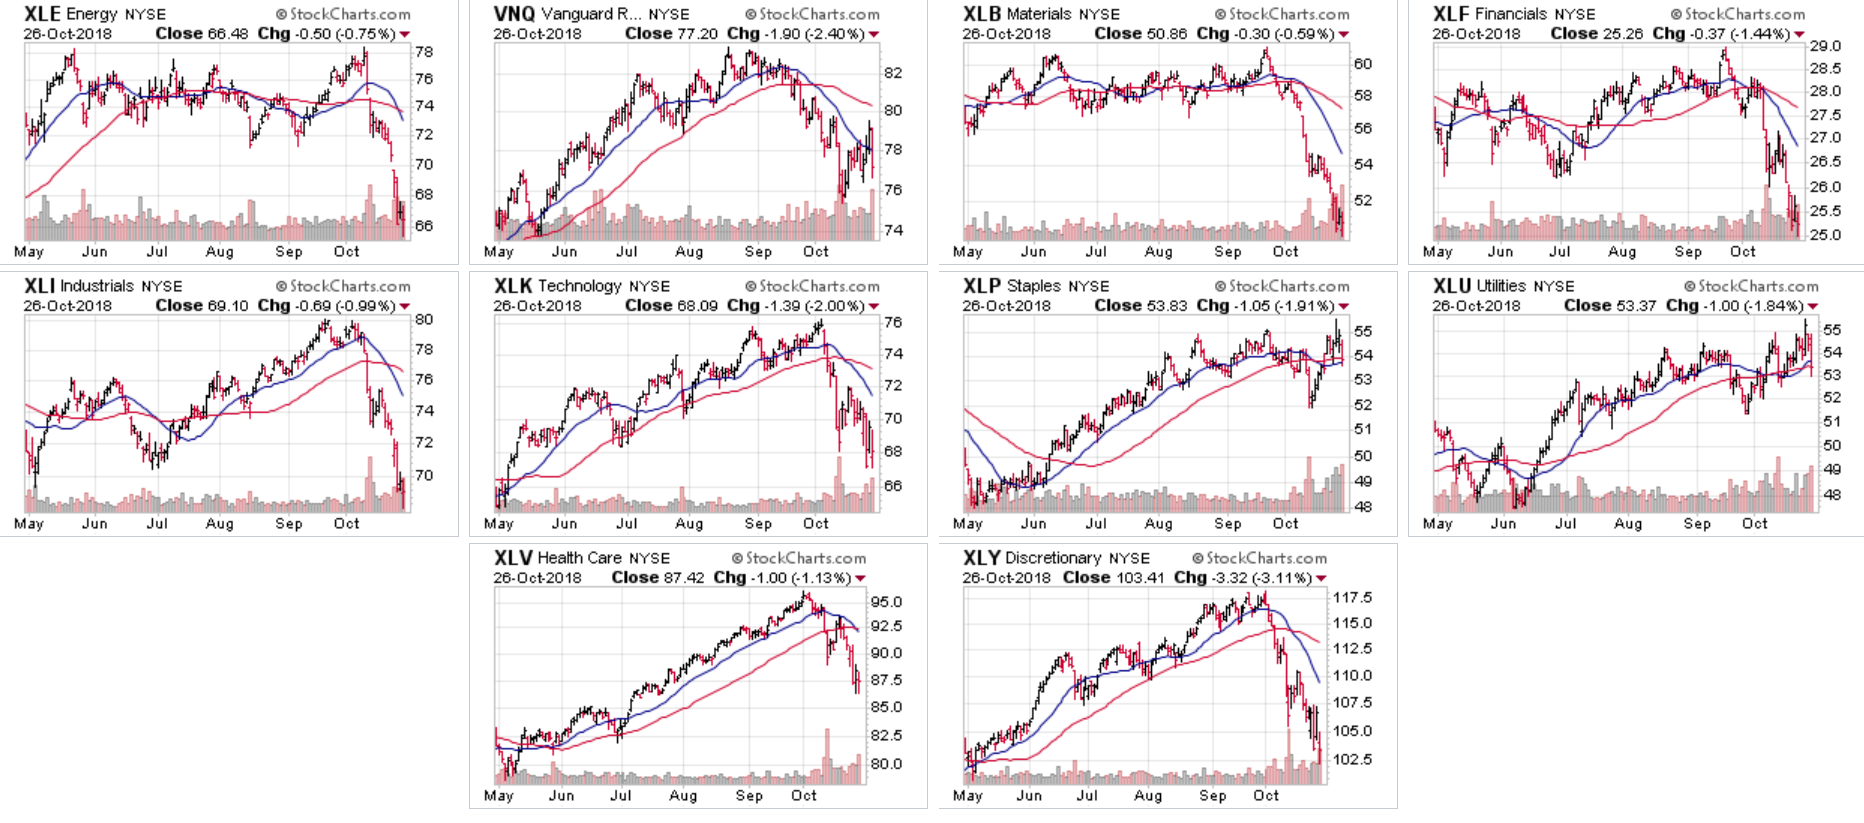
The six-month charts are pretty weak.
Let's begin where we always do, with the one-week, one-month, and three-month performance tables.
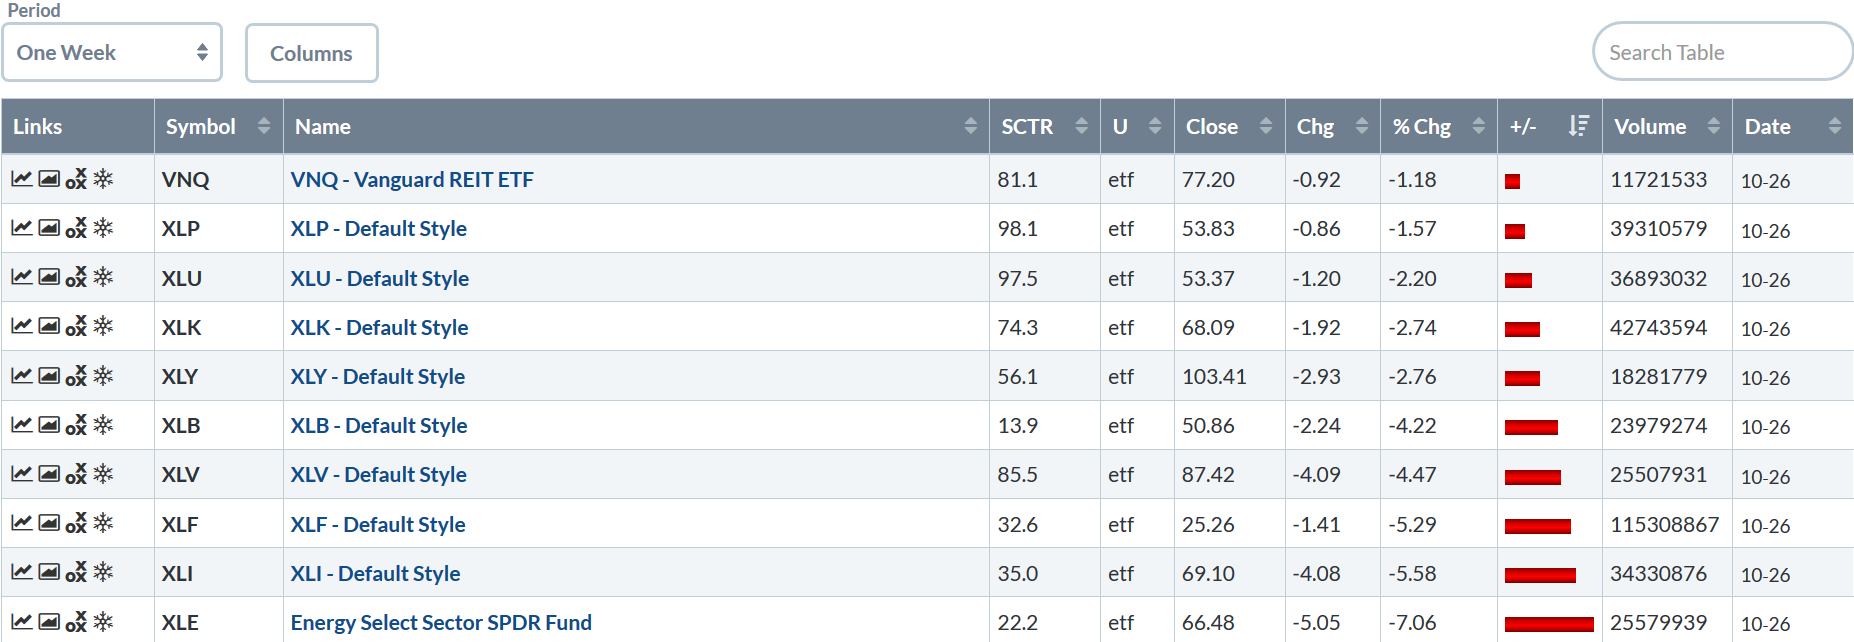
Going forward, note that use of the word "performance" is a relative term as most sectors are down. The one-week performance table above is no exception with all the major ETFs off for the week. While it might seem odd that the REIT ETF was the "best performer," remember that Treasury bonds rallied this week sending interest rates lower, lowering the cost of capital for the real estate sector. The second- and third best-performing sectors where consumer staples and utilities, respectively, which is consistent with the standard late-cycle sector performance.
Next, let's examine the one-month performance table:
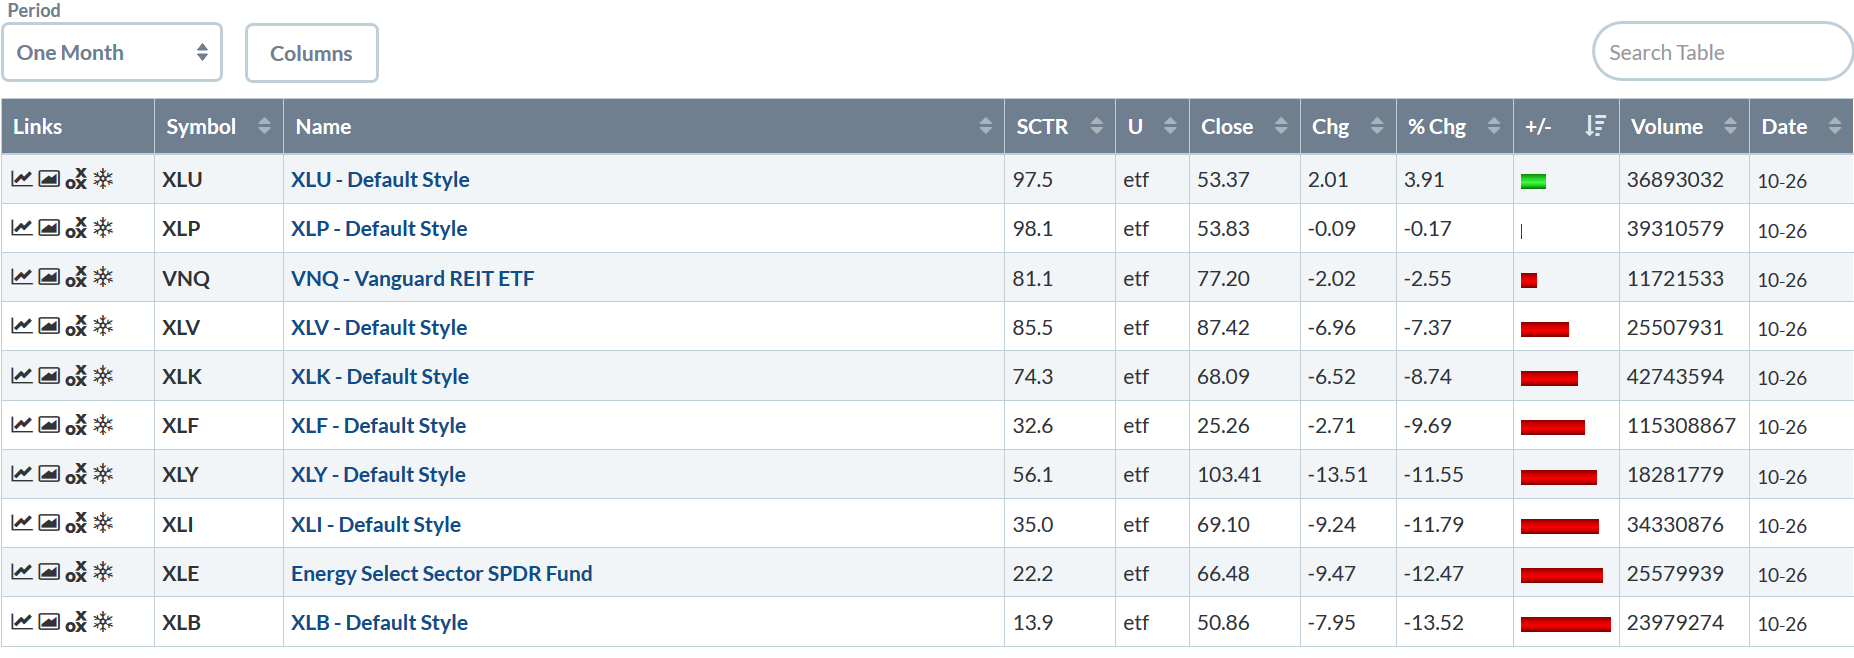
Utilities and consumer staples were the "best performing" sectors, which again is consistent with late-cycle sector performance. Healthcare was off 7.37%, but was still the fourth best-performing sector ETF over the one-month time span. Again, we see sector performance consistent with standard late-cycle theory.
Finally, we have the three-month performance table:
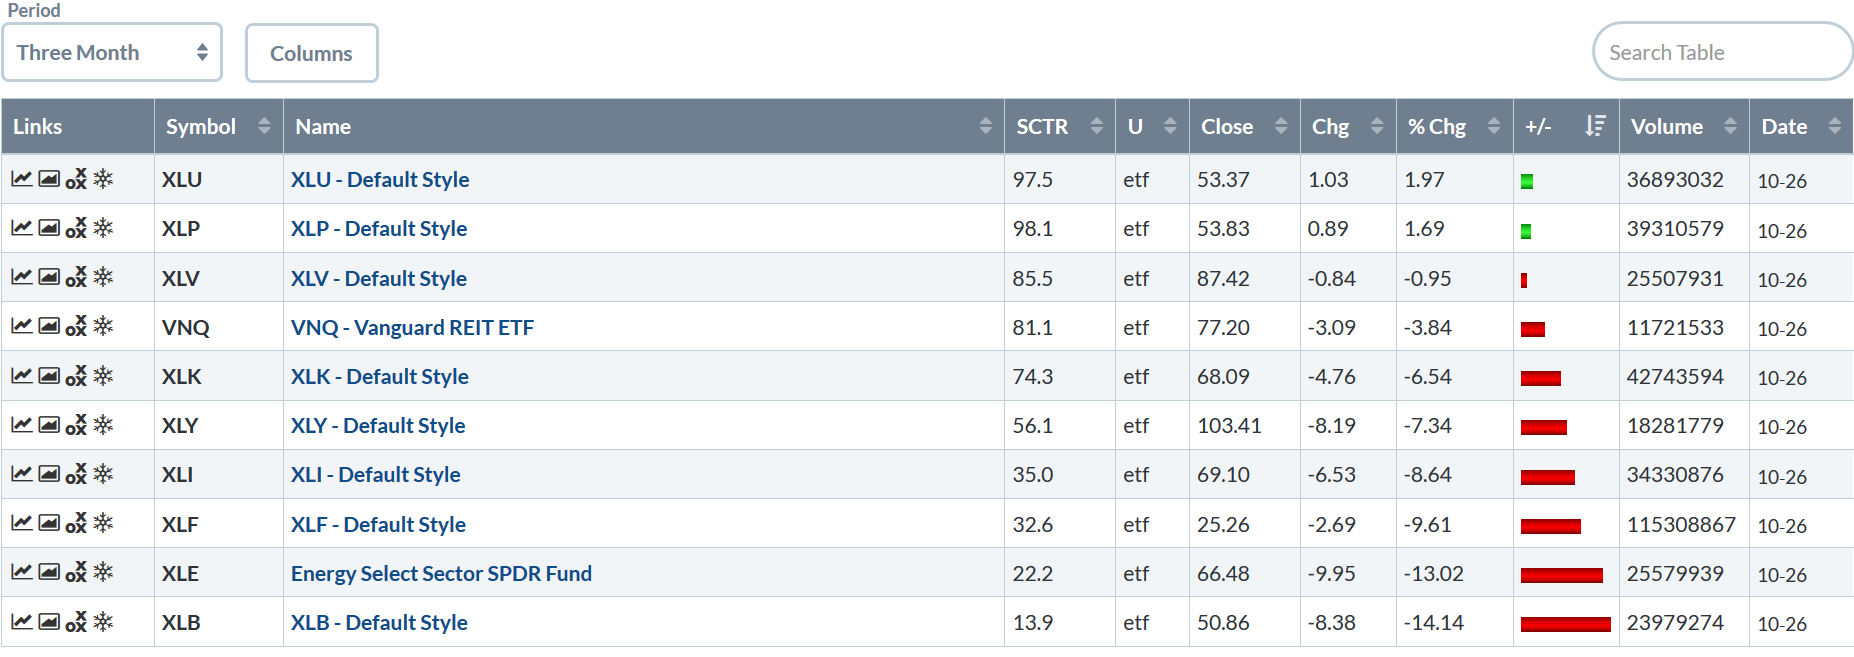
Utilities, consumer staples, and healthcare are the one, two, and three best performers, which we would expect for the later stages of a bull market.
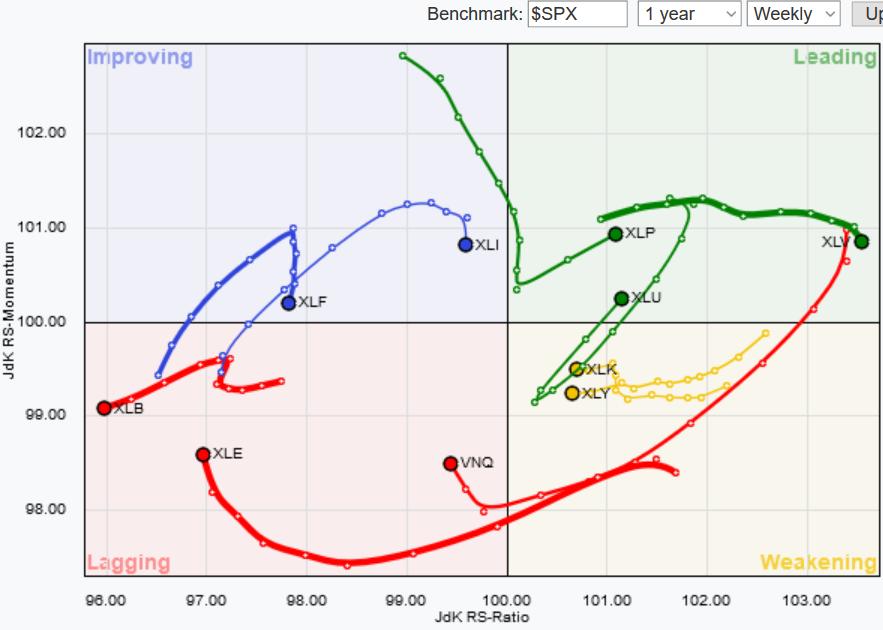
The following graph shows the relative performance of all major sector ETFs relative to the S&P 500 during the preceding 10-week period:
Consumer staples, utilities, and healthcare are leading the S&P 500, which you would expect at the end of a bull market. Technology and consumer staples are weakening. This is also significant as it indicates that traders are, at a minimum, taking gains in two sectors that had been leading the market during the latest rally. Real estate, energy, and basic materials are lagging the market. Real estate is falling due to the Fed's rate hiking posture; energy is off due to oil's recent price declines; and basic materials are down due to increased trade tensions. Finally, industrials and financials have taken a turn for the worse over the last few weeks, moving more towards eight "weakening" posture.
Over the last three months, we've seen a shift in sector performance to one that is most associated with the end of a bull market. In this scenario, traders gravitate towards "safer sectors" such as utilities, consumer staples, and healthcare. While these three will probably decline in a market sell-off, they will do so to a lesser degree, as they either pay hefty dividends (utilities), pay a modest dividend, and provide a necessary good (consumer staples), or provide a necessary good or service (healthcare). We are seeing such a development over the last few months.
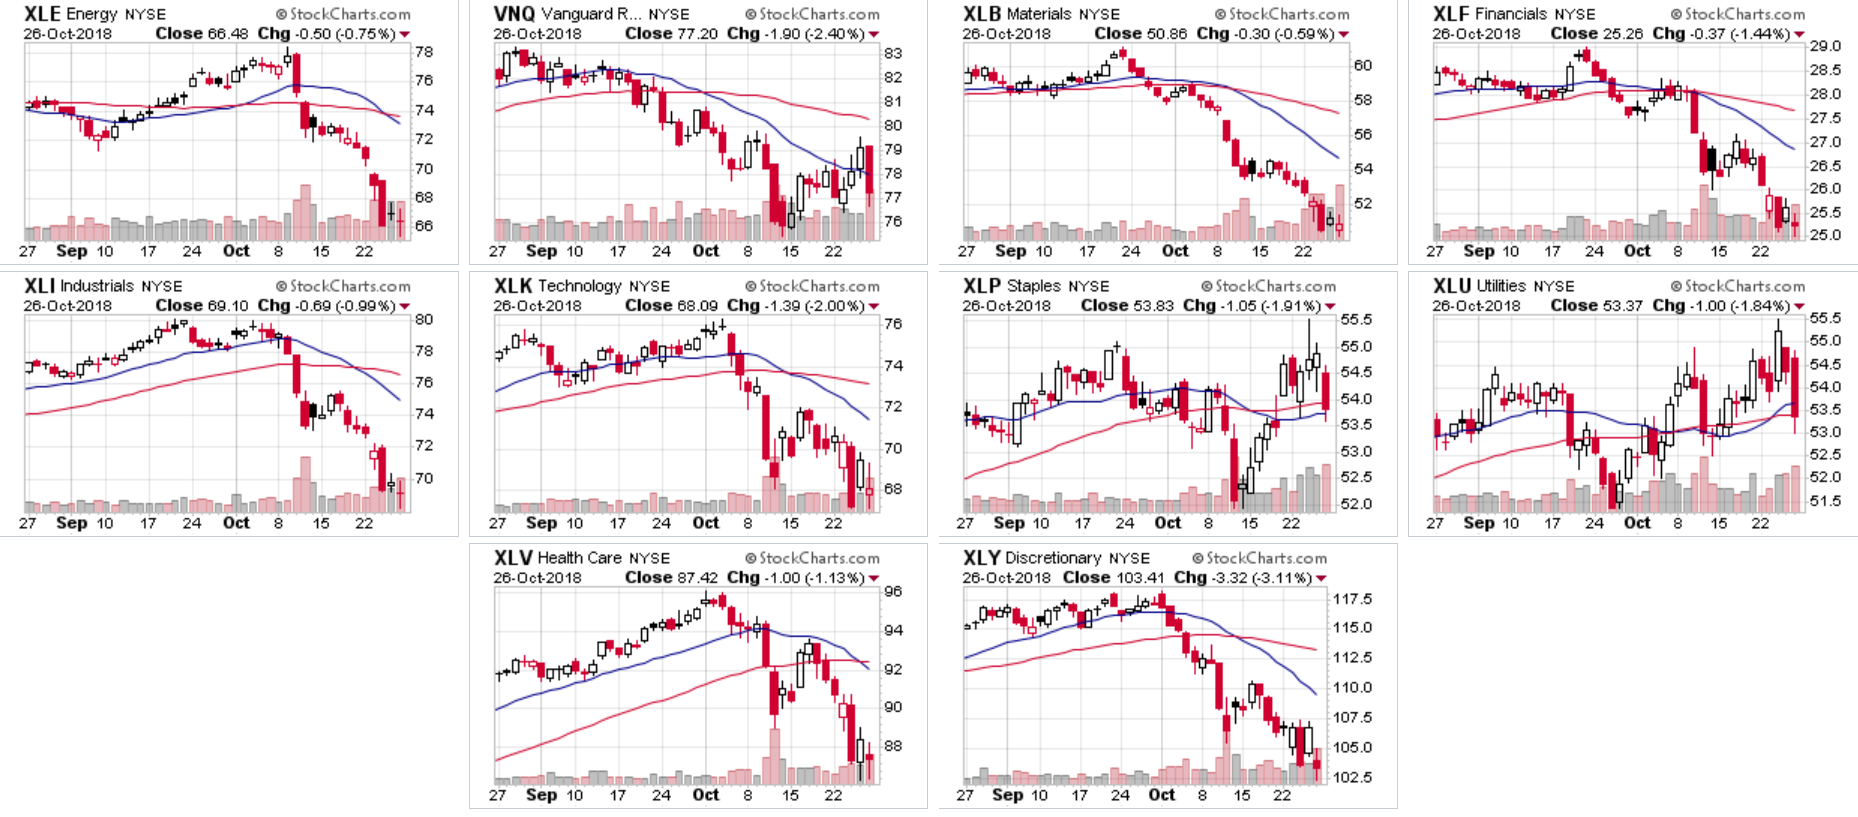
Next, let's look at the 2-month charts:
There are a lot of downtrends. In fact, only two sectors (staples and utilities, middle row, last two on the right) have any kind of short-term uptrend.
The six-month charts add additional bearish context. Only utilities (middle row, far right) have an uptrend, and that one is very slight. The staples ETF (middle row, second from right) was moving sideways, sold off at the beginning of October, and are now back to previous price levels. Real estate (top row, second from left) is in a short-term rally but only after a pretty big sell-off.
Disclosure:I/we have no positions in any stocks mentioned, and no plans to initiate any positions within the next 72 hours.
I wrote this article myself, and it expresses my own opinions. I am not receiving compensation for it (other than from Seeking Alpha). I have no business relationship with any company whose stock is mentioned in this article.

