🍎 🍕 Less apples, more pizza 🤔 Have you seen Buffett’s portfolio recently?Explore for Free

Scratching The Bubble’s Surface

Published 03/04/2021, 12:33 AM
Updated 07/09/2023, 06:31 AM
US500
-
US10YT=X
-
SPSUPX
-

There is a belief on Wall Street that future corporate earnings can only grow in an environment where borrowing is so cheap. Indeed, inflation-adjusted interest rates (a.k.a. “real rates”) are negative, and that means companies are effectively being paid to borrow.

Recently, however, real rates have been on the rise. They’ve nearly flipped from negative to positive.

When real rates are trending in an unfavorable direction, history suggests that investors value stocks at much lower P/E multiples. Five years ago, inflation-adjusted rates were associated with Forward P/Es of 18. That alone might require stocks to reprice 15%-20% lower from the 3900 level on the S&P 500, or 3120-3315.
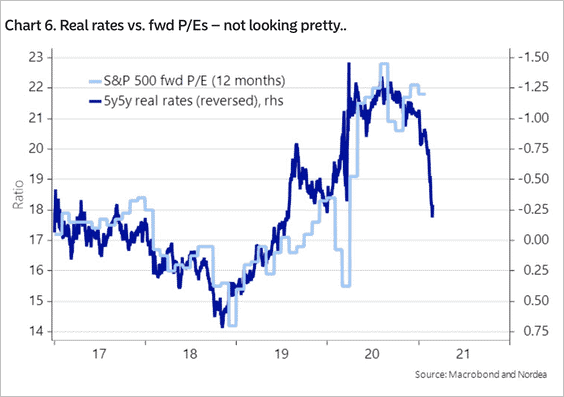
Real Rates Vs Fwd PE Chart

Forward 12-month earnings ‘guestimates’ of how companies may fare are not the only cause for concern. Should actual earnings be adversely affected by rate trends, or should investors be unwilling to pay 30x trailing 12-month earnings due to those rate trends, the stock market repricing could be quite severe.

Consider the math. Even if earnings managed to grow 6%-8% in 2021, P/Es (trailing) that reverted to their mean of 15 could see stocks plummet 49%-50%.
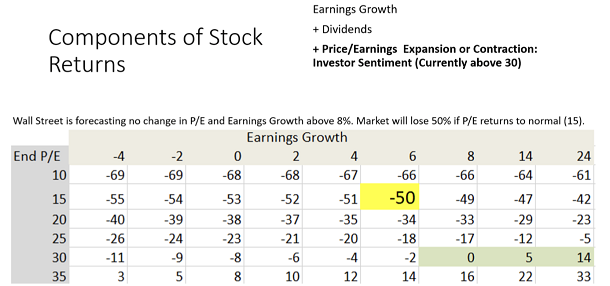
Components Of Stock Return

The problem, of course, is the amount of money creation by both the Federal Reserve and the Federal government. When you increase the money supply (M2) by 25% in a single year (blue line below), the printing activity can lead to a loss of purchasing power á la inflation. The financial markets, if left to their own devices, will push interest rates higher to compensate.
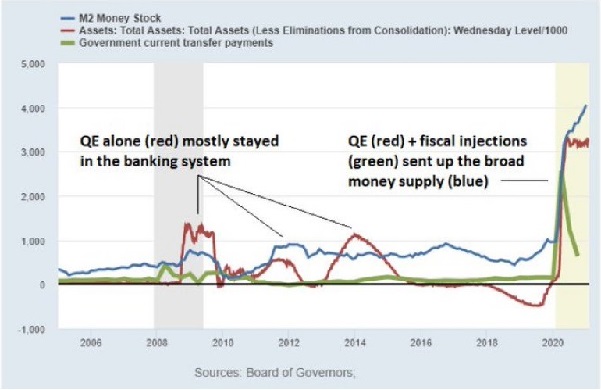
M2 Money Stock Chart

It follows that the Fed may choose to intervene, by switching its bond buying of shorter maturities to bond buys of 10-year Treasuries and above. Bringing down 10-year yields would be a preferred method of reigning in borrowing costs.

Is it likely to calm volatility in the market? Probably. On the other hand, with the S&P Composite more than 3 standard deviations above trend, any additional scratches on the stock balloon may result in a painful regression to the mean.
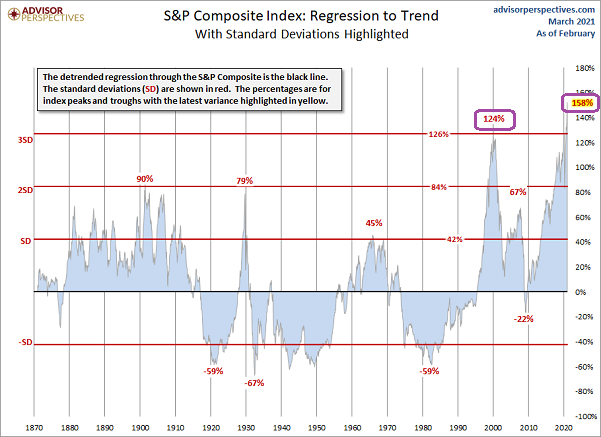
S&P 500 Composite Index Chart

Latest comments

Loading next article…
Risk Disclosure: Trading in financial instruments and/or cryptocurrencies involves high risks including the risk of losing some, or all, of your investment amount, and may not be suitable for all investors. Prices of cryptocurrencies are extremely volatile and may be affected by external factors such as financial, regulatory or political events. Trading on margin increases the financial risks.
Before deciding to trade in financial instrument or cryptocurrencies you should be fully informed of the risks and costs associated with trading the financial markets, carefully consider your investment objectives, level of experience, and risk appetite, and seek professional advice where needed.
Fusion Media would like to remind you that the data contained in this website is not necessarily real-time nor accurate. The data and prices on the website are not necessarily provided by any market or exchange, but may be provided by market makers, and so prices may not be accurate and may differ from the actual price at any given market, meaning prices are indicative and not appropriate for trading purposes. Fusion Media and any provider of the data contained in this website will not accept liability for any loss or damage as a result of your trading, or your reliance on the information contained within this website.
It is prohibited to use, store, reproduce, display, modify, transmit or distribute the data contained in this website without the explicit prior written permission of Fusion Media and/or the data provider. All intellectual property rights are reserved by the providers and/or the exchange providing the data contained in this website.
Fusion Media may be compensated by the advertisers that appear on the website, based on your interaction with the advertisements or advertisers.
© 2007-2024 - Fusion Media Limited. All Rights Reserved.