We all know what Peter Schiff thinks about stocks and gold. You can tell from his picture. But do you know what John Bollinger thinks? Well I did not talk to either of them, and if you read my articles you probably know I'm no fan of Peter Schiff. However I am interested in what the Modified Schiff Pitchfork and Bollinger Bands® have to say about the S&P 500.
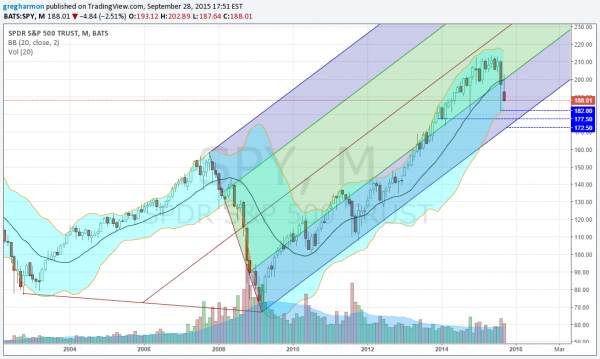
The chart below is a monthly chart of the S&P 500 SPDR (NYSE:SPY) going back to 2004. I have added just these 2 indicators for a cleaner view. What do they show? The Modified Schiff Pitchfork (modified by Andrews of Pitchfork fame) shows the price pulling back after nearing the Median Line. But it also shows that the uptrend is not in jeopardy until a move down to about 172.50 where an October candle would touch the Lower Median Line.
The Bollinger Bands show that the price has pierced the midline (the 20 month SMA) and will close under it for the first time since September 2011. Bollinger Bands are a measure of volatility and often end up being a reversal point when they do not open as price touches them. At present the Bollinger Bands actually closing as price falls with the lower Band at about 182. This could be a reversal or support area.
In between the two prices is the natural volume based support at 177.50. This gives 3 possible reversal points for the SPY over the next 5 weeks: 182, 177.50 and 172.50. Any, all or none could end up stopping the fall. But all are places to be ready for possible reversal action.
The information in this blog post represents my own opinions and does not contain a recommendation for any particular security or investment. I or my affiliates may hold positions or other interests in securities mentioned in the Blog, please see my Disclaimer page for my full disclaimer.

