🧐 ProPicks AI October update is out now! See which stocks made the listPick Stocks with AI

S&P500: US Indices Recovered, Technical Analysis

Published 05/24/2017, 06:17 AM
Updated 07/09/2023, 06:31 AM
US500
-

As a result of the four-day growth, the S&P 500 index fully recovered losses suffered earlier amid renewed hype around the US president. With the opening of today's trading day, the S&P 500 index is trading in a narrow range, pending the publication of the minutes from the May meeting of the Fed.

The positive dynamics of the S&P 500 index is preserved. Since February 2016, the S&P 500 index has been growing steadily and is in the ascending channels on the daily and weekly charts.

At the moment, the S&P 500 again tests the resistance level of 2400.0, reached in early March, for breakdown.

The indicators OsMA and Stochastics on the daily chart again turned to long positions. In case of resumption of growth, the nearest target will be level 2415.0 (the upper limit of the uplink on the daily chart).

The reverse scenario will be associated with breakdown of the short-term support level 2386.0 (EMA200 on the 1-hour chart) and a decrease with the nearest targets near the levels 2355.0 (bottom line of the uplink on the daily chart), 2326.0 (April lows). Only the breakdown of support levels of 2275.0 (EMA200 on the daily chart), 2265.0 (Fibonacci level of 23.6% correction to growth since February 2016) will cancel the bullish trend of the index.

Support levels: 2386.0, 2375.0, 2355.0, 2326.0, 2305.0, 2275.0, 2265.0
Resistance levels: 2400.0, 2415.0

Trading Recommendations
Sell ​​Stop 2385.0. Stop-Loss 2405.0. Objectives 2375.0, 2355.0, 2326.0, 2275.0, 2265.0
Buy Stop 2405.0. Stop-Loss 2385.0. Objectives 2415.0, 2450.0, 2500.00

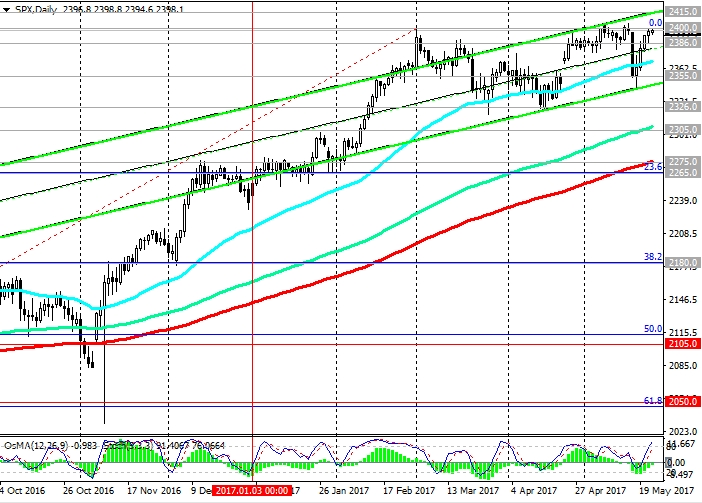
S&P 500 Chart

Latest comments

Loading next article…
Risk Disclosure: Trading in financial instruments and/or cryptocurrencies involves high risks including the risk of losing some, or all, of your investment amount, and may not be suitable for all investors. Prices of cryptocurrencies are extremely volatile and may be affected by external factors such as financial, regulatory or political events. Trading on margin increases the financial risks.
Before deciding to trade in financial instrument or cryptocurrencies you should be fully informed of the risks and costs associated with trading the financial markets, carefully consider your investment objectives, level of experience, and risk appetite, and seek professional advice where needed.
Fusion Media would like to remind you that the data contained in this website is not necessarily real-time nor accurate. The data and prices on the website are not necessarily provided by any market or exchange, but may be provided by market makers, and so prices may not be accurate and may differ from the actual price at any given market, meaning prices are indicative and not appropriate for trading purposes. Fusion Media and any provider of the data contained in this website will not accept liability for any loss or damage as a result of your trading, or your reliance on the information contained within this website.
It is prohibited to use, store, reproduce, display, modify, transmit or distribute the data contained in this website without the explicit prior written permission of Fusion Media and/or the data provider. All intellectual property rights are reserved by the providers and/or the exchange providing the data contained in this website.
Fusion Media may be compensated by the advertisers that appear on the website, based on your interaction with the advertisements or advertisers.
© 2007-2024 - Fusion Media Limited. All Rights Reserved.