S&P Reaches Above 1900.00

Published 05/27/2014, 01:23 AM
Updated 05/14/2017, 06:45 AM
US500
-

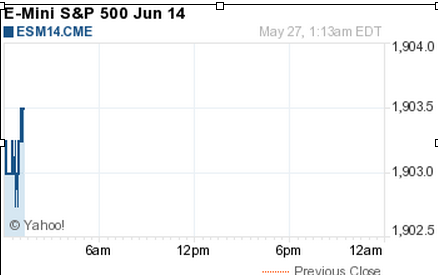
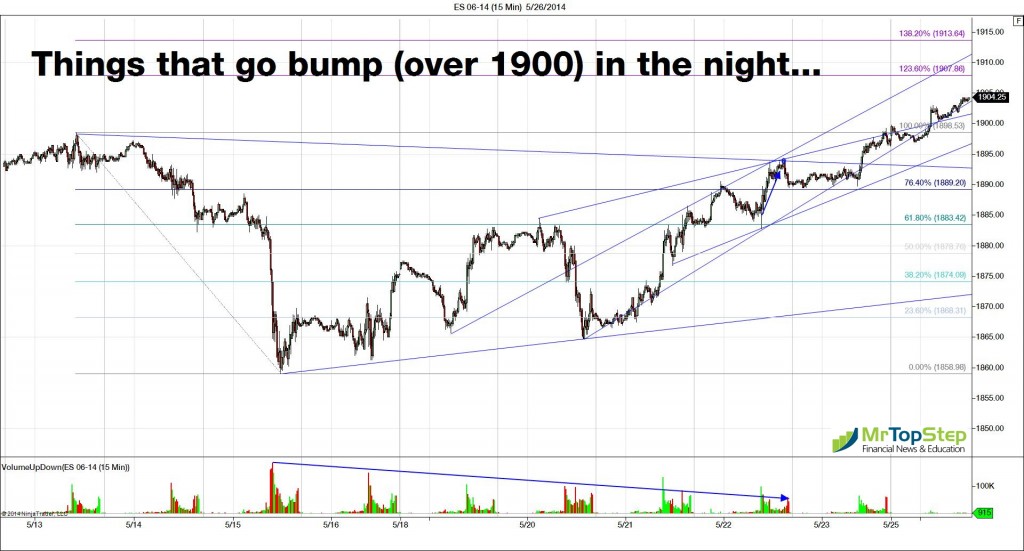
Haunted by low volume the S&P fell short of 1900.00 during Friday’s trade, but finally traded up to 1904 during Sunday night’s abbreviated Memorial Day session.

S&P 500 Chart

Short But Big Week Ahead 

The Asian markets closed mostly higher and in Europe 10 out of 12 markets are trading higher. Despite the exchanges being closed in honor of Memorial Day the rest of the four-day week is packed with 23 economic reports, 12 T-bill and T-Bond announcements or auctions and 6 Fed governors speaking Thursday and Friday.

Straight up, we have been warning you about the ‘thin to win” environment and with the VIX this low there is a concern that the S&P may take off to 1940-1950. We’re not saying right away but we do not expect people will be hurrying back to trade on Tuesday.

When they do come back, they may find prices in the low 1900s waiting for them. The shorts will cover and exit and the longs may take profits or increase their positions. And let’s not forget the large number of buy stops sitting above 1905.

I said a few weeks ago that it’s not just 1900 the S&P is seeking and that by year end the S&P will be trading at or near 2000.00. You can take it from there…

As always please keep an eye on the 10-handle rule and please use stops when trading futures and options.

  • In Asia, 7 of 11 markets closed higher: Shanghai Comp. +0.34% , Hang Seng -0.01%, Nikkei +0.79%.
  • In Europe, 10 of 12 markets are trading higher : DAX +1.39%, FTSE -0.07%
  • Morning headline: “S&P 500 futures trading above 1900.00”
  • Fair Value: S&P -2.56, Nasdaq -1.34 , Dow -22.79
  • Total volume: LOW 44k ESM and 375 SPM traded
  • Economic calendar: Closed for US Memorial Day
  • E-mini S&P 5001903.25+6.25 - +0.33%
  • Crude102.15+0.02 - +0.02%
  • Shanghai Composite0.00N/A - N/A
  • Hang Seng22906.631-56.549 - -0.25%
  • Nikkei 22514714.64+112.12 - +0.77%
  • DAX9892.82+171.91 - +1.77%
  • FTSE 1006815.75-4.81 - -0.07%
  • Euro1.3652


E-Mini S&P 500 Chart
 

Latest comments

Loading next article…
Risk Disclosure: Trading in financial instruments and/or cryptocurrencies involves high risks including the risk of losing some, or all, of your investment amount, and may not be suitable for all investors. Prices of cryptocurrencies are extremely volatile and may be affected by external factors such as financial, regulatory or political events. Trading on margin increases the financial risks.
Before deciding to trade in financial instrument or cryptocurrencies you should be fully informed of the risks and costs associated with trading the financial markets, carefully consider your investment objectives, level of experience, and risk appetite, and seek professional advice where needed.
Fusion Media would like to remind you that the data contained in this website is not necessarily real-time nor accurate. The data and prices on the website are not necessarily provided by any market or exchange, but may be provided by market makers, and so prices may not be accurate and may differ from the actual price at any given market, meaning prices are indicative and not appropriate for trading purposes. Fusion Media and any provider of the data contained in this website will not accept liability for any loss or damage as a result of your trading, or your reliance on the information contained within this website.
It is prohibited to use, store, reproduce, display, modify, transmit or distribute the data contained in this website without the explicit prior written permission of Fusion Media and/or the data provider. All intellectual property rights are reserved by the providers and/or the exchange providing the data contained in this website.
Fusion Media may be compensated by the advertisers that appear on the website, based on your interaction with the advertisements or advertisers.
© 2007-2025 - Fusion Media Limited. All Rights Reserved.