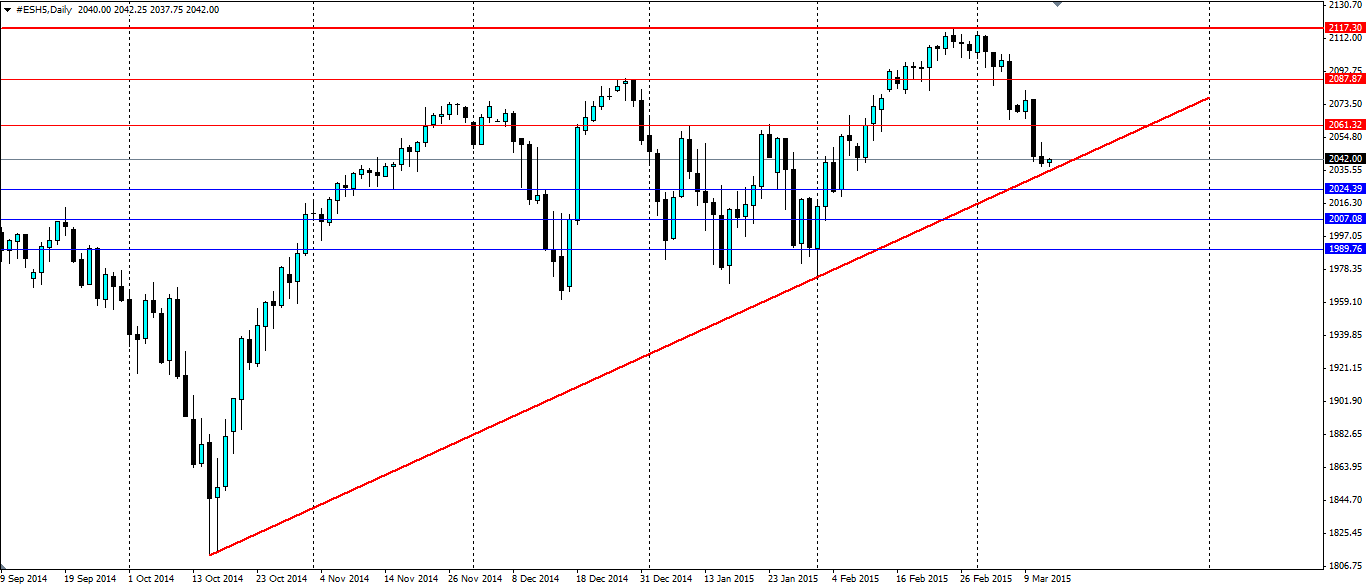
The S&P 500 has taken a bit of a hit recently as the US dollar strength erodes equity value and the prospect of higher interest rates weighs on returns. But a long term trend line could provide the support equity bulls are looking for.

(Source: Blackwell Trader)
The strong dollar is wreaking havoc on US equity markets at the moment as equity prices begin to look expensive to investors. The dollar is charging up the charts thanks to the ECB’s Quantitative Easing program significantly weakening the euro and boosting demand for the relatively higher yielding dollar.
Further adding pressure and causing equities to pull back from the recent record highs is that the Fed has remained committed to increasing interest rates by the middle of the year. In recent weeks we have seen a reduction in inflation rates which gave the stock bulls hope the Fed would hold off raising interest rates, but this was not to be.
Reasons for the record highs seen in equities recently are evident in the Labor markets. US Nonfarm payrolls have consistently been returning 200k+ results and the Unemployment claims' figures are averaging under the 300k mark. Manufacturing PMI’s and various other indicators are showing the relative strength in the US economy, which has helped to push stocks higher.
The pull back in the S&P 500 index has been held up by a perfect touch on the longer term trend line that dates back to October 2014. Since then there has been one touch of the trend line that rejected strongly and went on to produce the all-time highs. There will be plenty of equity bulls that will be watching this trend line closely for another strong rejection.
If we do see a rejection, look for resistance to be found at 2061.32, 2087.87 and 2117.30 as the index makes its way higher. It may even use the trend line as dynamic support as it moves higher. If we see a bearish breakout, look for support to be found at 2024.39, 2007.08 and 1989.76.
