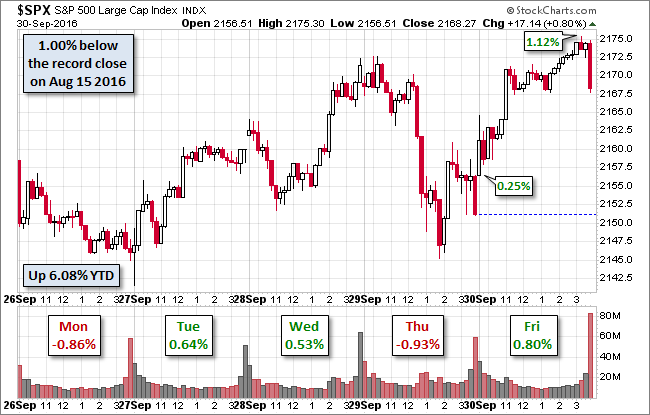
Deutsche Bank (DE:DBKGn) shares rebounded today and the US equity markets followed suit. The S&P 500 open at its 0.25% intraday low and rallied through the session to its 1.12% intraday high early in the final hour. Some selling shortly before the closing bell trimmed the Friday gain to 0.80%. The index finished the week with a fractional gain of 0.17%, but the month of September closed with a fractional loss of 0.12% — the second consecutive 0.12% monthly decline.
The yield on the 10-Year note closed at 1.60%, up four basis points from the previous close but down two BPs from the previous weekly close.
Here is a snapshot of past five sessions in the S&P 500.
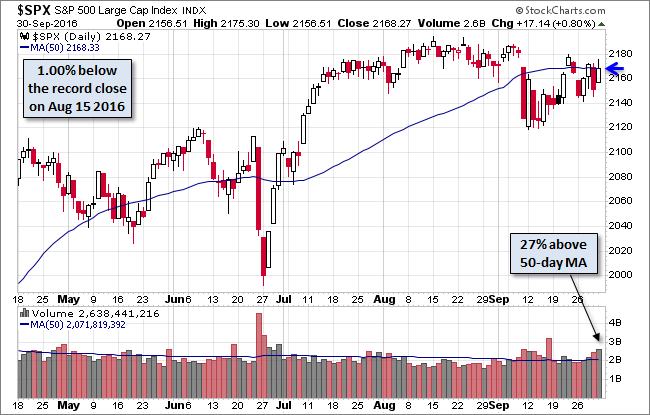
Here is daily chart of the index. Today's trading volume at the close of the week, month and quarter was on the high side for a non-options expiration session. Note that the selling in the final minutes put the price squarely on its 50-day moving average as we prepare for October.
A Perspective on Drawdowns
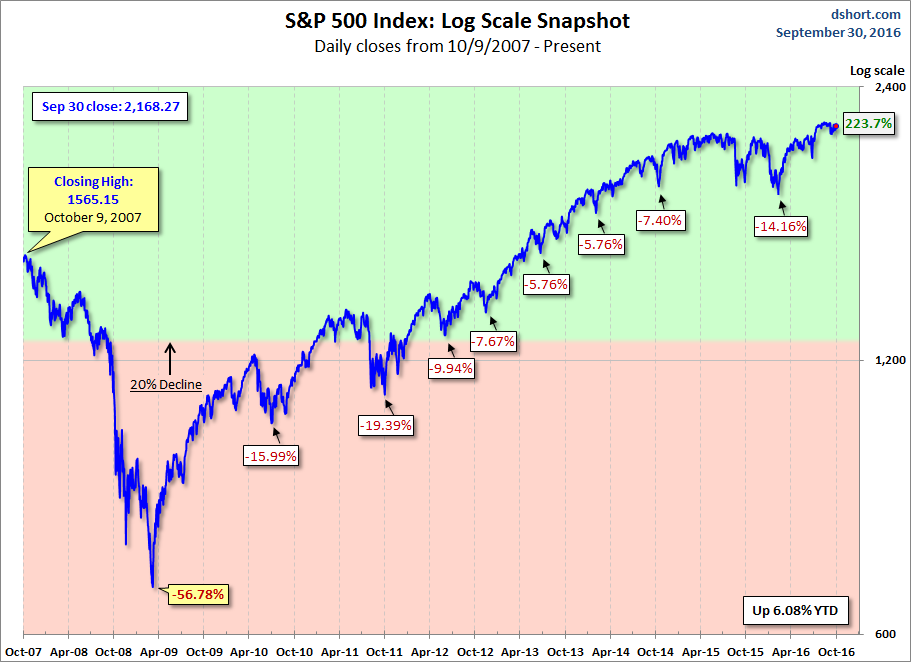
Here's a snapshot of selloffs since the 2009 trough.
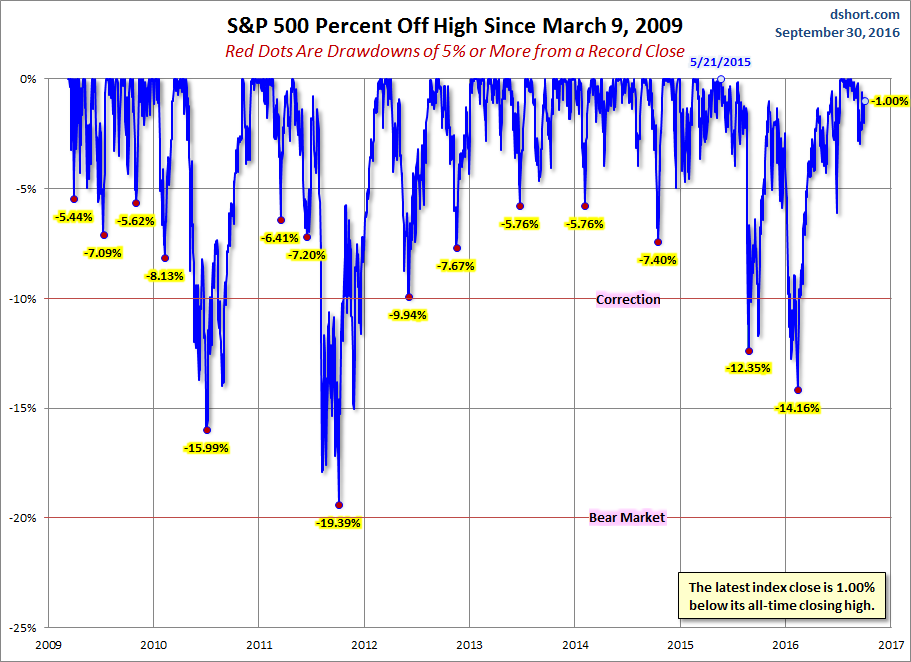
Here is a more conventional log-scale chart with drawdowns highlighted.
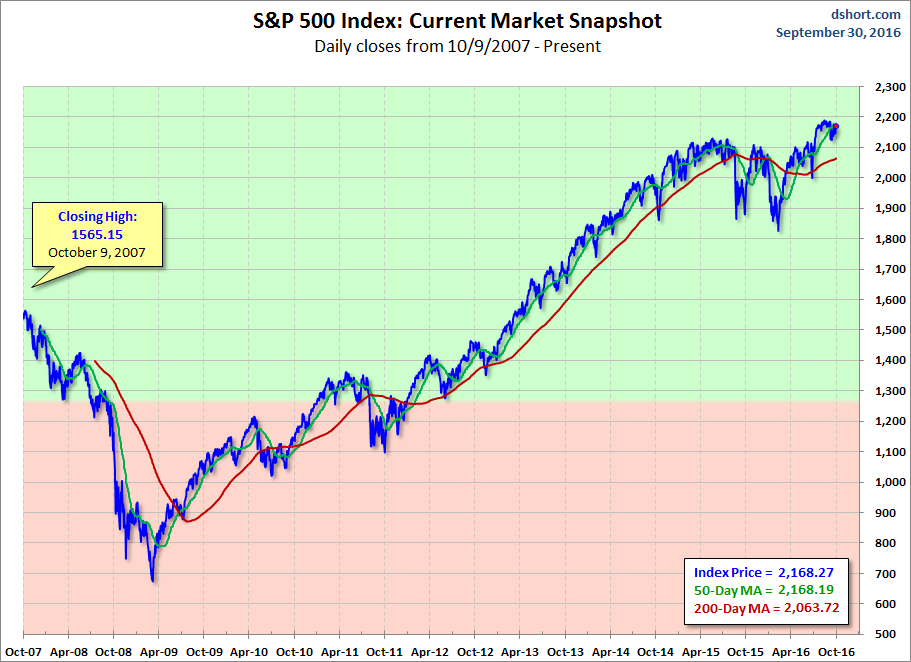
Here is a linear scale version of the same chart with the 50- and 200-day moving averages.
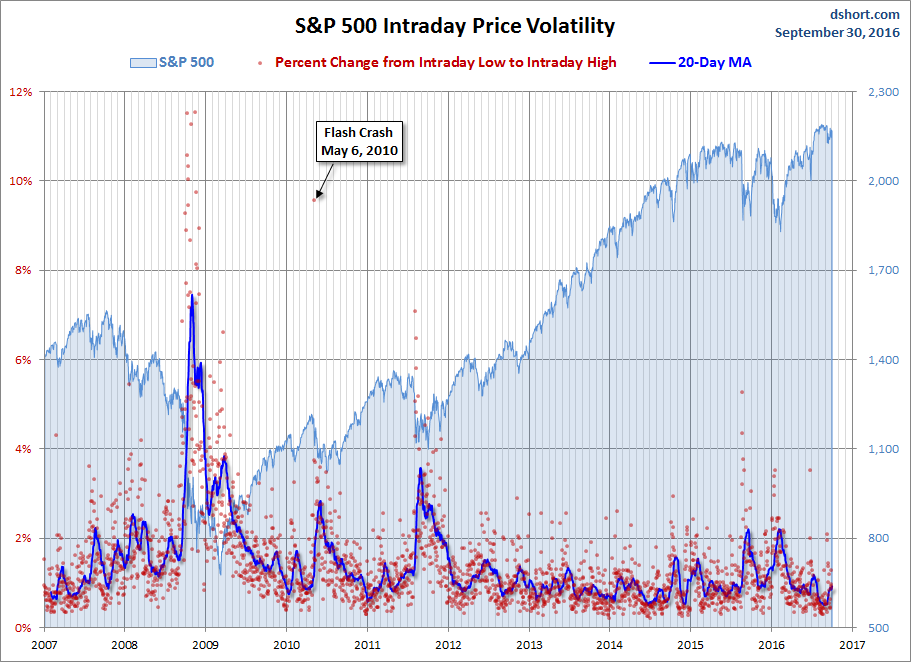
A Perspective on Volatility
For a sense of the correlation between the closing price and intraday volatility, the chart below overlays the S&P 500 since 2007 with the intraday price range. We've also included a 20-day moving average to help identify trends in volatility.
