Investing.com’s stocks of the week
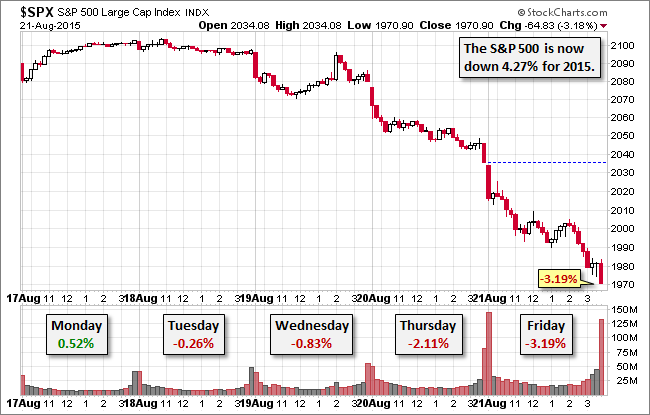
US equities took another beating today. The benchmark S&P 500 closed at its intraday low for the second consecutive day, down -2.11% yesterday and -3.16% today. The loss for the week is -5.77%. The index is in the red year-to-date, down -4.27%, and it is -7.51% off its record close on May 21st — about three quarters of the way to the conventional 10% correction.
The yield on the 10-year note closed the day at 2.05%, down 4 bps from yesterday's close.
Here is a snapshot of past five sessions:

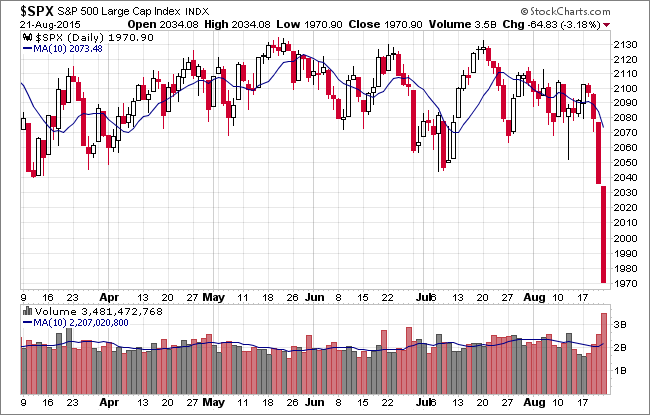
On a daily chart we see that volume has increased each day during this four-day selloff:

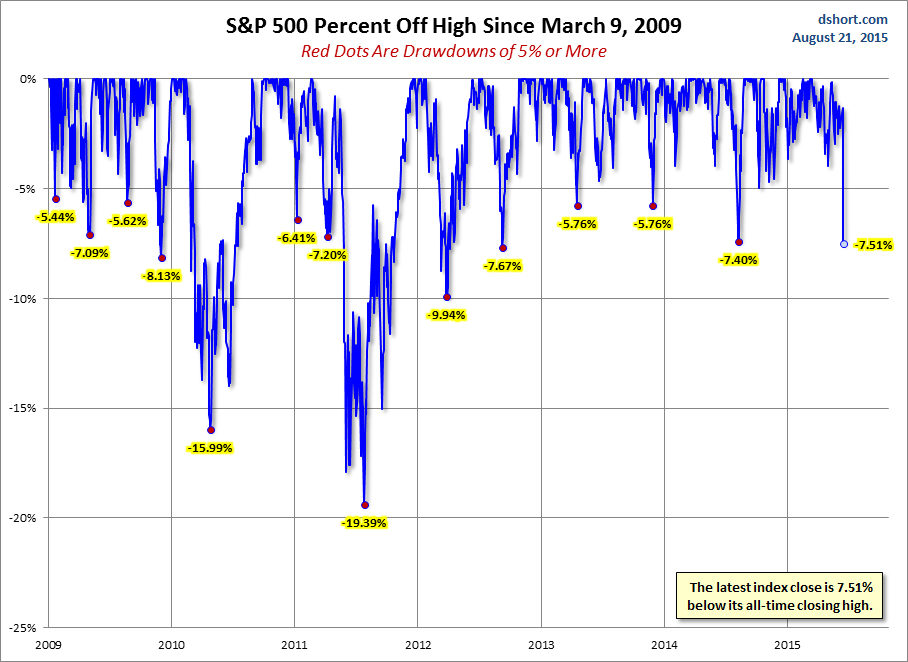
A Perspective on Drawdowns
Here's a snapshot of selloffs since the 2009 trough:

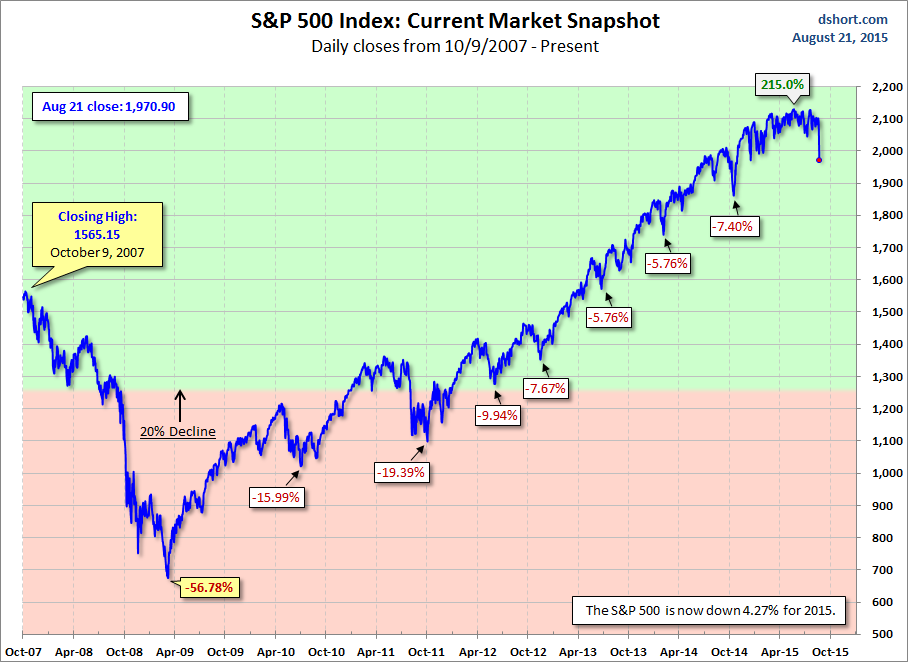
For a longer-term perspective, here is a charts base on daily closes since the all-time high prior to the Great Recession:

