Despite its fractional -0.09% Friday decline, the S&P 500 posted a weekly gain of 1.03% for the fourth week of 2017, ending two weeks of small declines. The index is up 2.50% year-to-date.
As the five-day snapshot illustrates, all of this past week's gains came on Tuesday and Wednesday, followed by a narrow trading range, mostly in the shallow red, on Thursday and Friday. In one respect, that Friday loss was surprisingly small given the disappointing 1.9% Advance Estimate of Q4 GDP and relatively weak headline Durable Goods. But the US equity market appears more aligned with the surge in post-election Consumer Sentiment.
Here is a snapshot of the past five sessions.

The U.S. Treasury puts the closing yield on the 10-year note at 2.48%, down one bp from the previous Friday close.
Here is a weekly chart of the index:

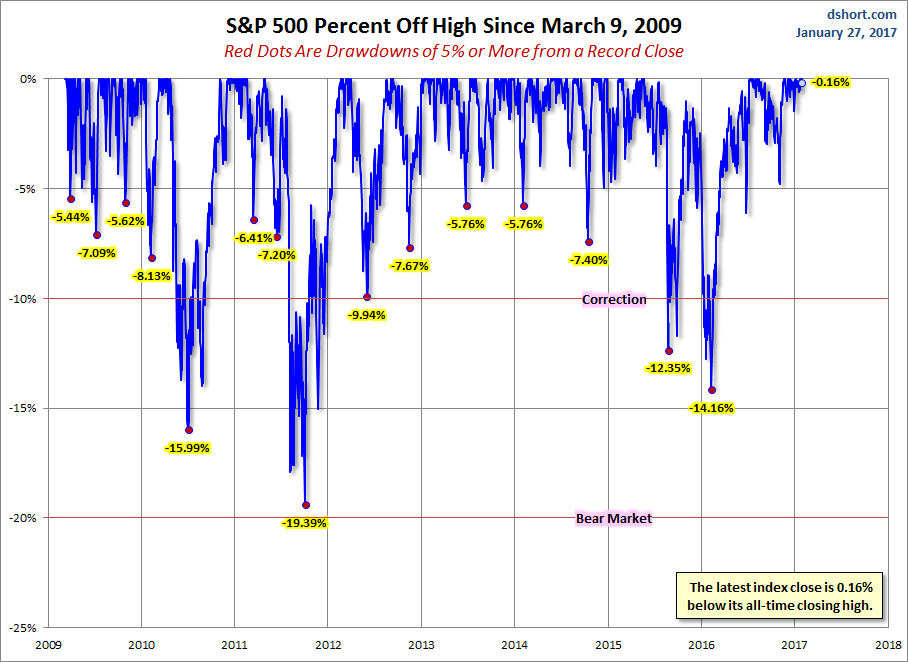
A Perspective on Drawdowns
Here's a snapshot of record highs and selloffs since the 2009 trough.
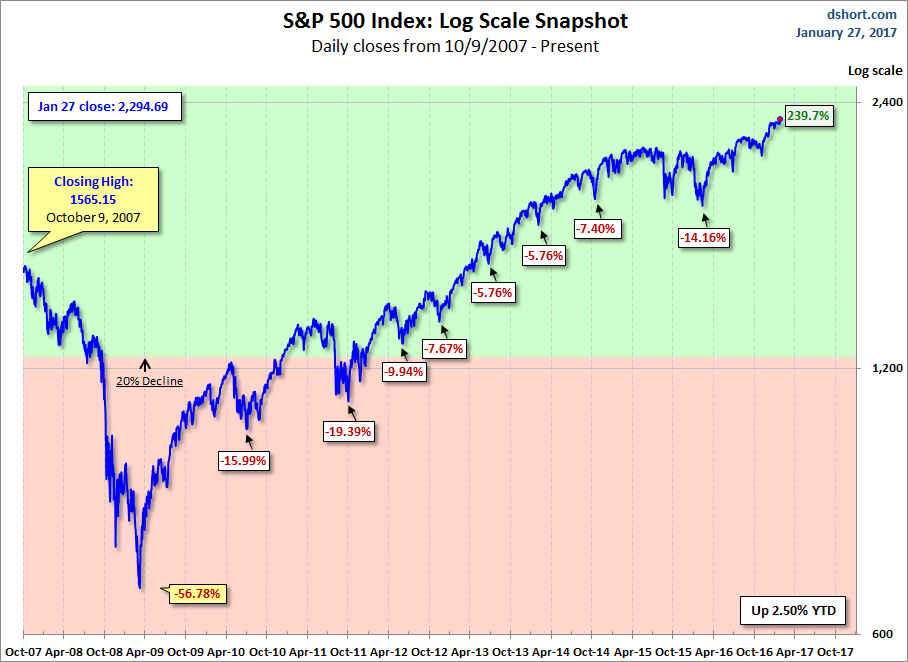
Here is a more conventional log-scale chart with drawdowns highlighted.
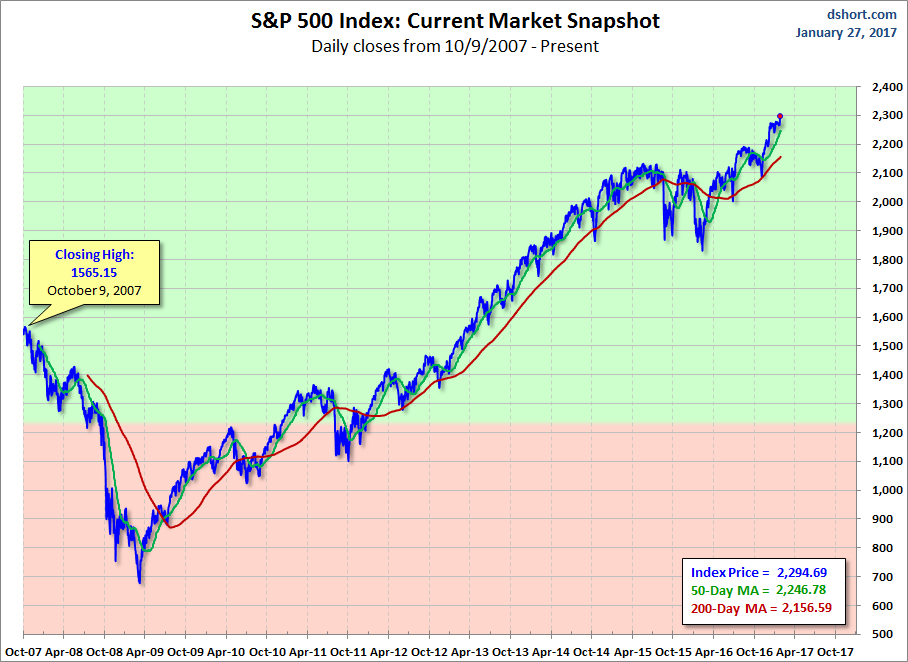
Here is a linear scale version of the same chart with the 50- and 200-day moving averages.
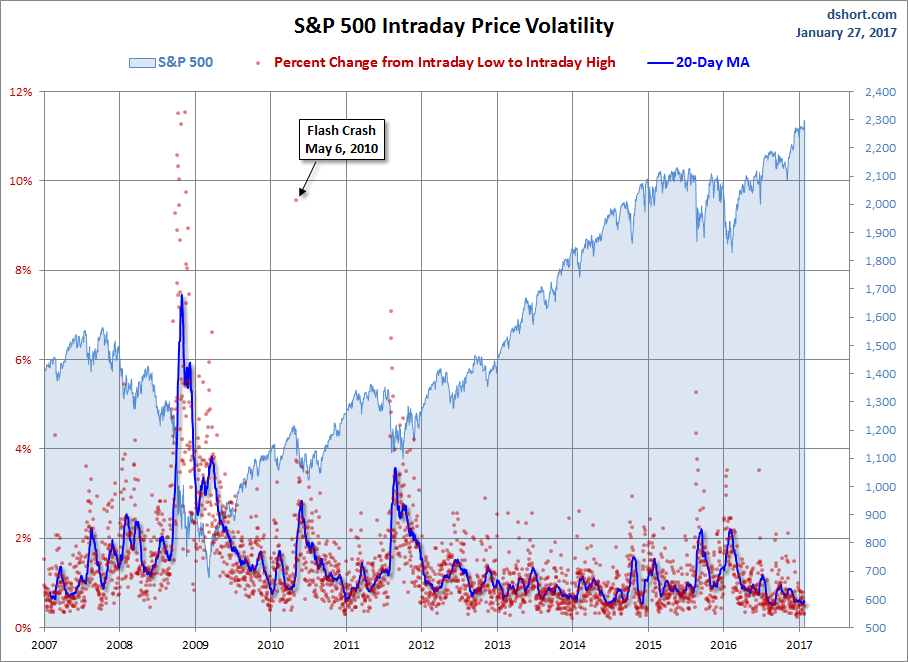
A Perspective on Volatility
For a sense of the correlation between the closing price and intraday volatility, the chart below overlays the S&P 500 since 2007 with the intraday price range. We've also included a 20-day moving average to help identify trends in volatility.