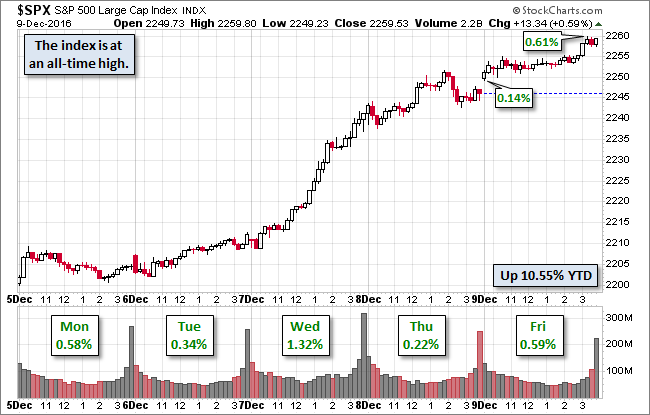
The S&P 500 posted gains each day of the week, with solid 0.58% and 0.59% advances on Monday and Friday, lesser gains of 0.34% and 0.22% on Tuesday and Thursday, and a strong surge of 1.32% at midweek. The week-over-week tally is an impressive 3.08%.
This was the third largest weekly gain of 2016. The Presidential Election rally began on November 7th, the Monday before the actual vote, with a 2.22% surge. The rally thus far consists of 17 gains in the past 24 sessions for a total gain of 8.36%. Will the rally continue, with the assistance of strong Consumer Sentiment and the seasonal crescendo in Santa's sleigh bells? Stay tuned!
The selloff in Treasuries continued Friday with the yield on the 10-year note closing at 2.47%, up seven BPs from its previous close.
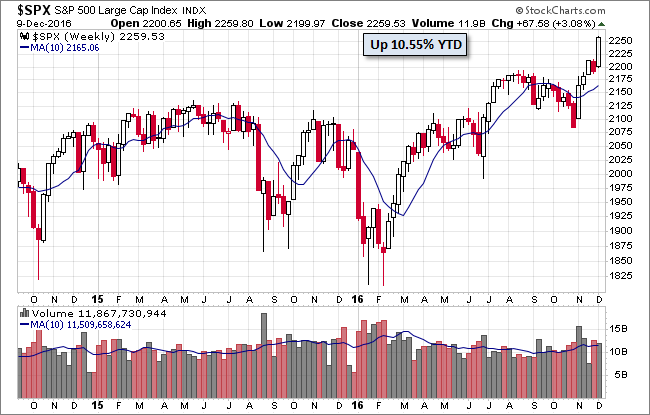
Here is a weekly chart of the index.
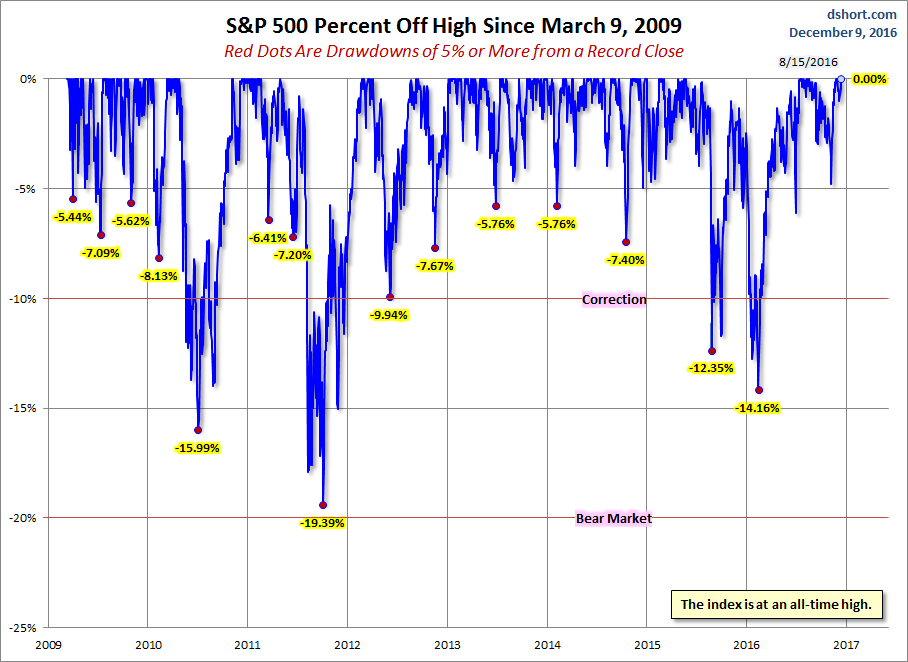
A Perspective on Drawdowns
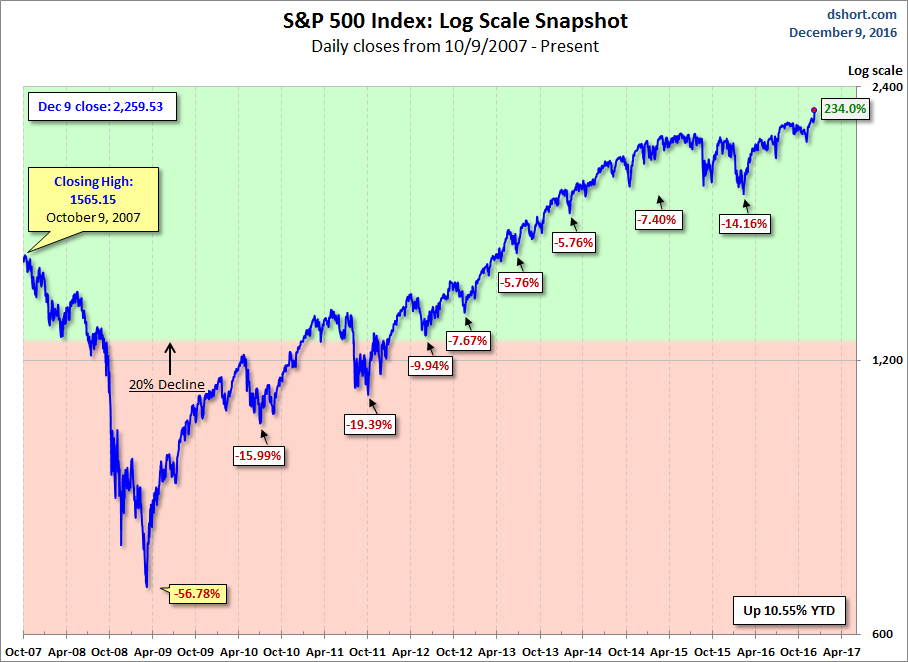
Here's a snapshot of selloffs since the 2009 trough.
Here is a more conventional log-scale chart with drawdowns highlighted.
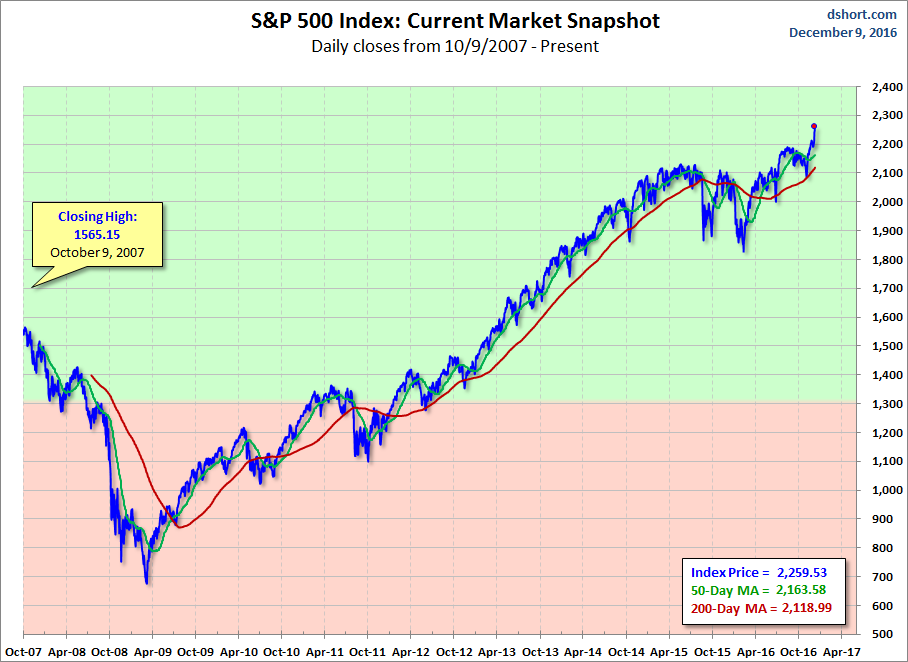
Here is a linear scale version of the same chart with the 50- and 200-day moving averages.
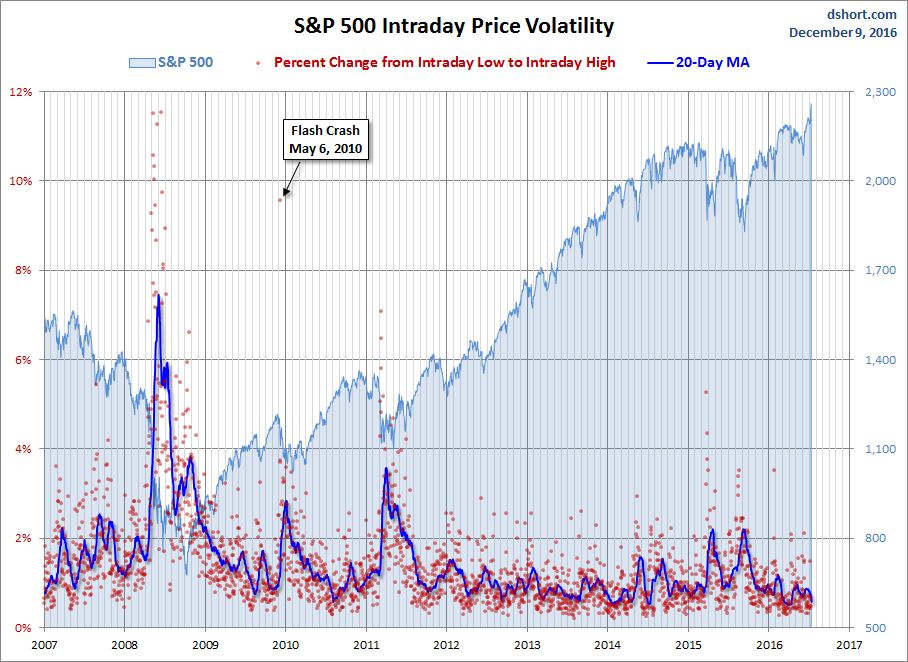
A Perspective on Volatility
For a sense of the correlation between the closing price and intraday volatility, the chart below overlays the S&P 500 since 2007 with the intraday price range. We've also included a 20-day moving average to help identify trends in volatility.
