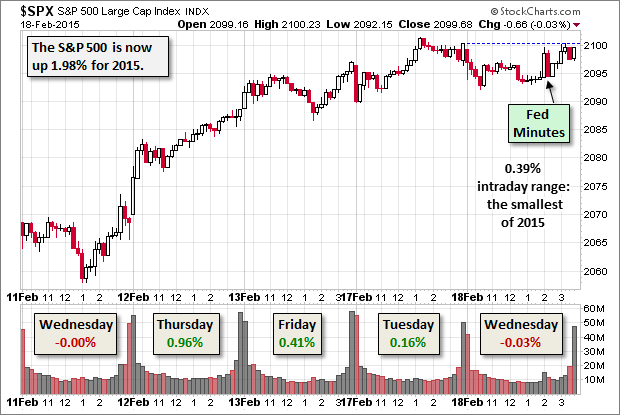
The S&P 500 spent the day in its narrowest trading range of the year yesterday between its -0.39% low in the opening hour and its -0.01% low 40 minutes before the close. Yesterday's pre-market economic news included a surprisingly low Producer Price Index and slightly weaker than forecast Industrial Production Yesterday's potential market mover was the 2 PM release of the FOMC minutes for the January 28-29 meeting, which occasioned a brief trading event. The index closed ending the day with tiny slippage (0.3%) from Tuesday's record close.
The yield on the 10-Year note closed at 2.07%, down seven bps from Tuesday's close.
Here is a 15-minute chart of the last five sessions.
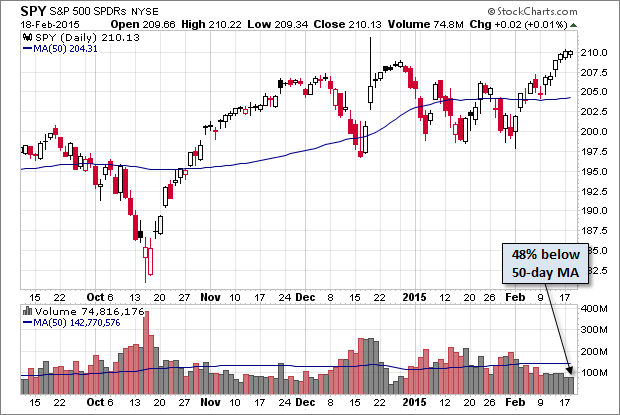
Here is a daily chart of the SPY ETF, which gives a better sense of investor participation. It posted a fractional gain for a record closing high. But as we can see, volume has been shrinking.
A Perspective on Drawdowns
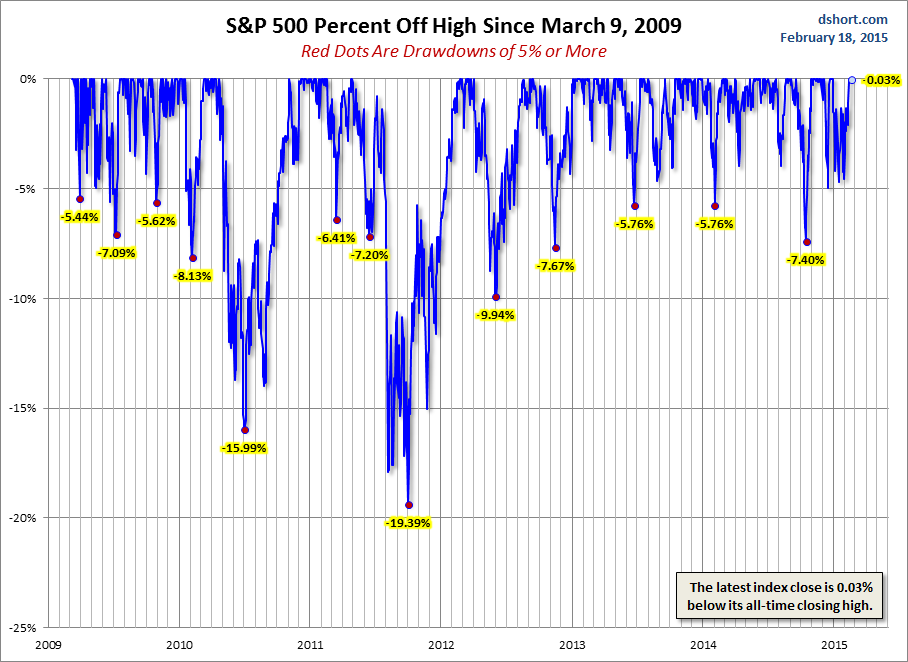
Here's a snapshot of sell-offs since the 2009 trough. The S&P 500 is 0.03% off its record close of Tuesday.
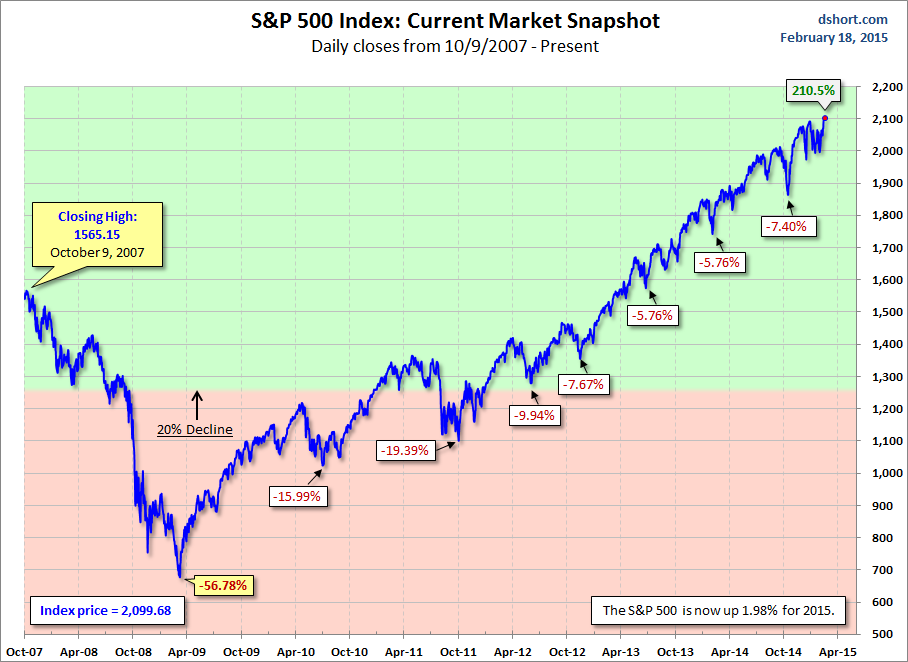
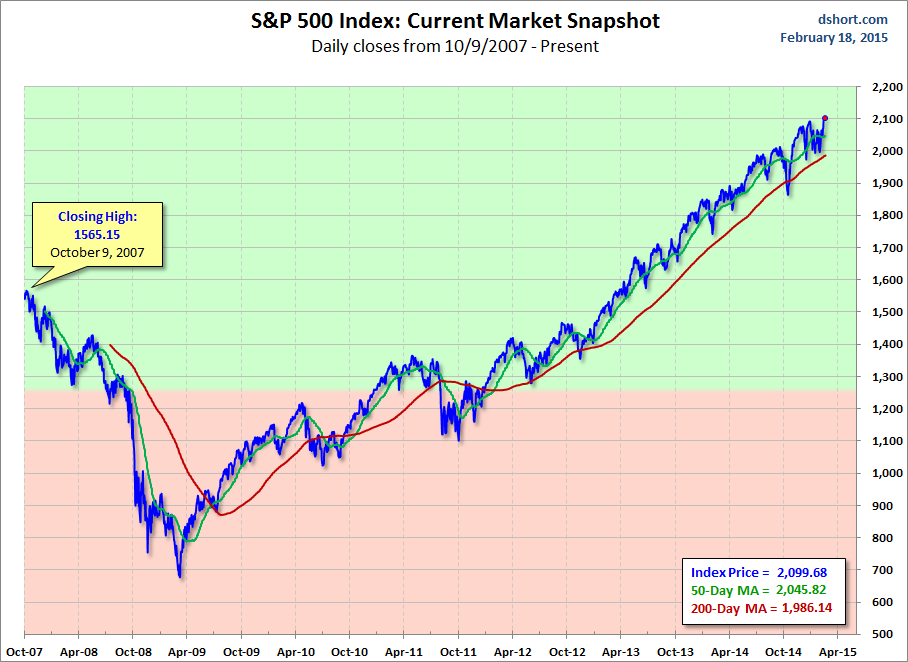
For a longer-term perspective, here is a pair of charts based on daily closes starting with the all-time high prior to the Great Recession.

