S&P 500 Snapshot: Four-Day Rally Ends

Published 10/14/2015, 12:23 AM
Updated 07/09/2023, 06:31 AM
US500
-
TYH25
-

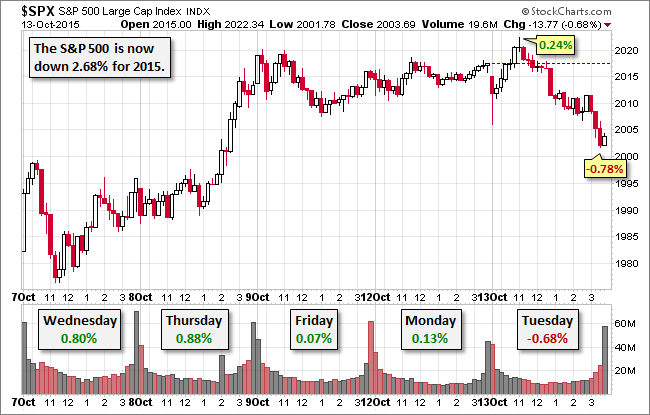
The S&P 500 snapped a four-day with a modest decline. Actually that four-day advance was largely the result of the first two sessions. The two sessions before today's loss were tiny. The index slumped at the open and then rose to its 0.24% intraday high about 90 minutes later. Selling then became the order of the day. The closing decline of -0.68% was off the -0.78% intraday low a few minutes before the bell.

The yield on the 10-year note closed the session at 2.06%, down 6 bps from the previous close.

Here is a snapshot of past five sessions.
S&P 500 Chart

Volume was light on today's decline.

S&P 500 Daily Chart

A Perspective on Drawdowns

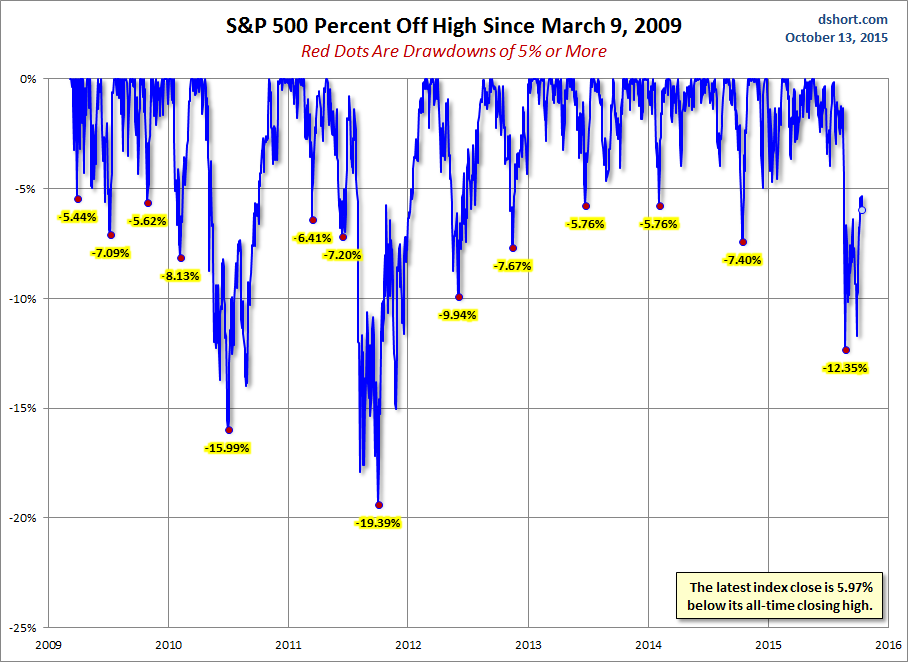
Here's a snapshot of selloffs since the 2009 trough.
S&P 500 Drawdowns

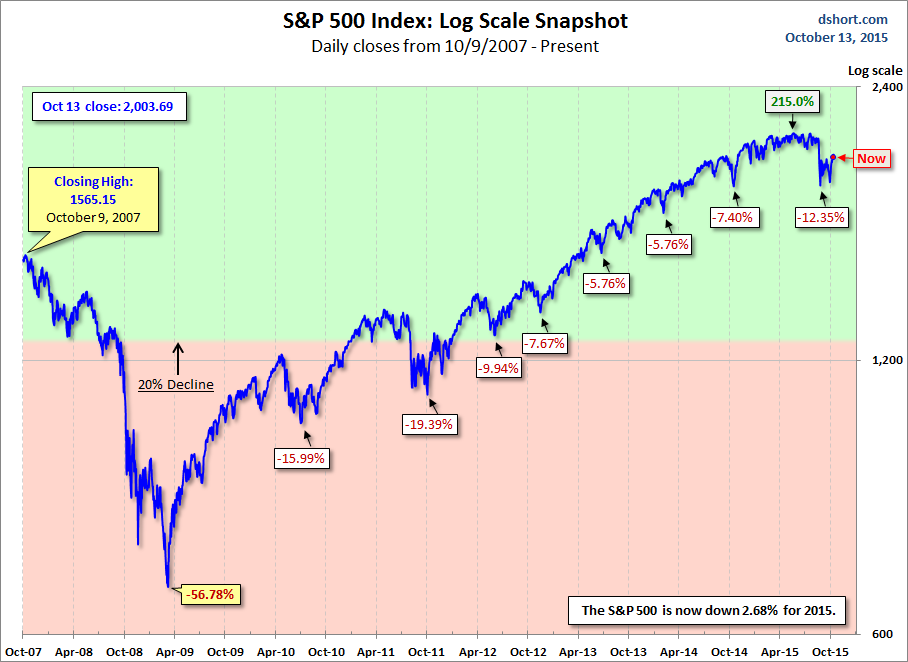
For a longer-term perspective, here is a log-scale chart base on daily closes since the all-time high prior to the Great Recession.
S&P 500 Snapshot

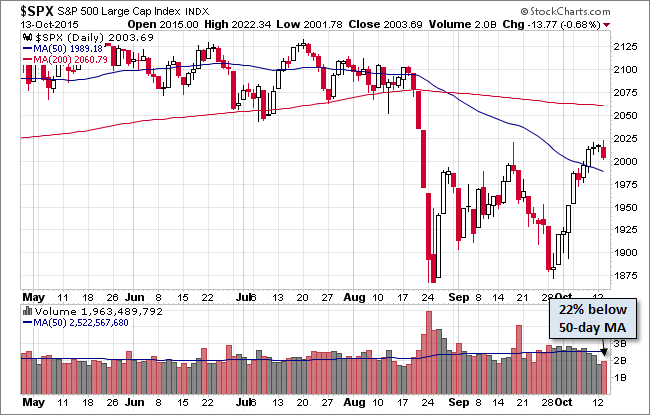
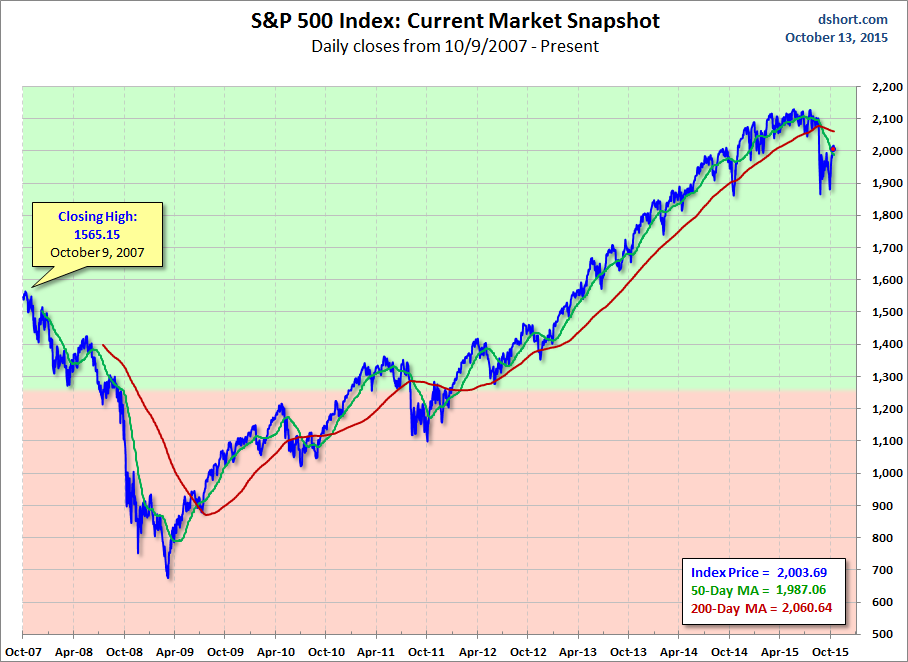
Here is the same chart with the 50- and 200-day moving averages. The 50 crossed below the 200 on August 28th.
S&P 500 MAs

Latest comments

Loading next article…
Risk Disclosure: Trading in financial instruments and/or cryptocurrencies involves high risks including the risk of losing some, or all, of your investment amount, and may not be suitable for all investors. Prices of cryptocurrencies are extremely volatile and may be affected by external factors such as financial, regulatory or political events. Trading on margin increases the financial risks.
Before deciding to trade in financial instrument or cryptocurrencies you should be fully informed of the risks and costs associated with trading the financial markets, carefully consider your investment objectives, level of experience, and risk appetite, and seek professional advice where needed.
Fusion Media would like to remind you that the data contained in this website is not necessarily real-time nor accurate. The data and prices on the website are not necessarily provided by any market or exchange, but may be provided by market makers, and so prices may not be accurate and may differ from the actual price at any given market, meaning prices are indicative and not appropriate for trading purposes. Fusion Media and any provider of the data contained in this website will not accept liability for any loss or damage as a result of your trading, or your reliance on the information contained within this website.
It is prohibited to use, store, reproduce, display, modify, transmit or distribute the data contained in this website without the explicit prior written permission of Fusion Media and/or the data provider. All intellectual property rights are reserved by the providers and/or the exchange providing the data contained in this website.
Fusion Media may be compensated by the advertisers that appear on the website, based on your interaction with the advertisements or advertisers.
© 2007-2025 - Fusion Media Limited. All Rights Reserved.