Investing.com’s stocks of the week
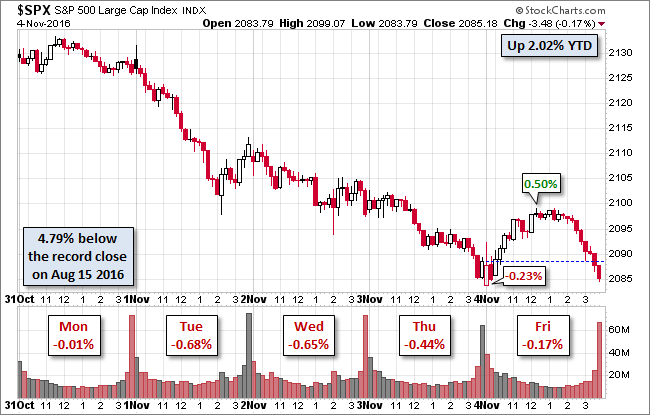
The S&P 500 posted another modest loss, extending its current selloff to nine sessions. The last nine-session selloff ended on December 11, 1980 ... about five weeks shy of 36 years ago. The index opened at its intraday low and whipsawed with indecision in the first 15 minutes of trading despite a good October employment report. It then traced a fairly symmetrical arc through the rest of the session with a mid-day peak gain of 0.50%. The afternoon saw an accelerating decline to its -0.17% close. The current nine-session loss is -3.07%.
Now for some context: The nine-day selloff in 1980 was a far more dramatic -9.37%. And consider this: We've had 13 nine-session sequences ending in 2016 with a cumulative decline of more than -3.07%. In fact, the single daily decline in 2016 was -3.59% on June 24th.
The 10-year Note closed the session at 1.79%, down three BPs from the previous close.
Here is a snapshot of past five sessions in the S&P 500.
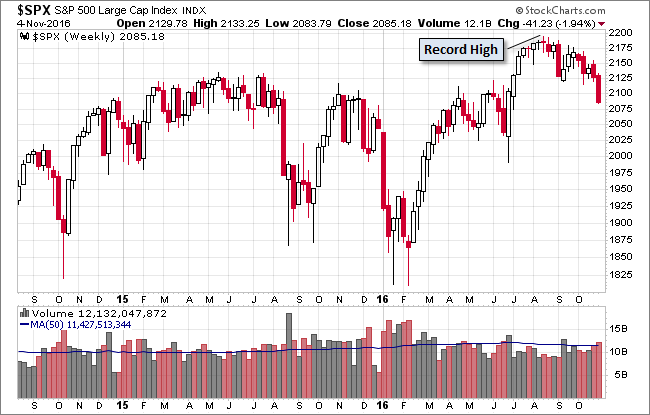
Here's a weekly chart of the index, which is down 1.94% week-over-week. Trading volume was slightly above its 50-week moving average.
A Perspective on Drawdowns
Here's a snapshot of selloffs since the 2009 trough.
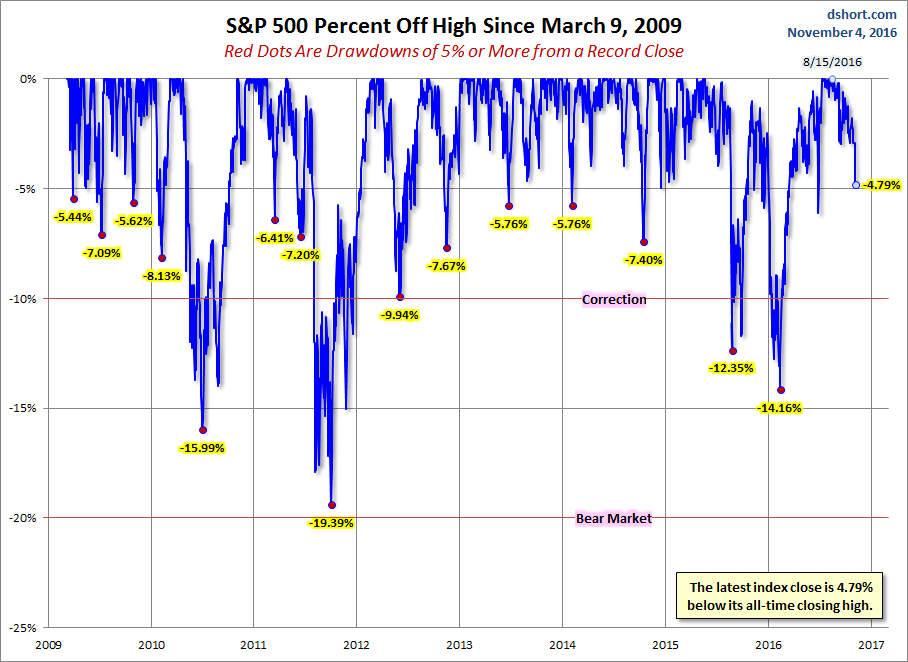
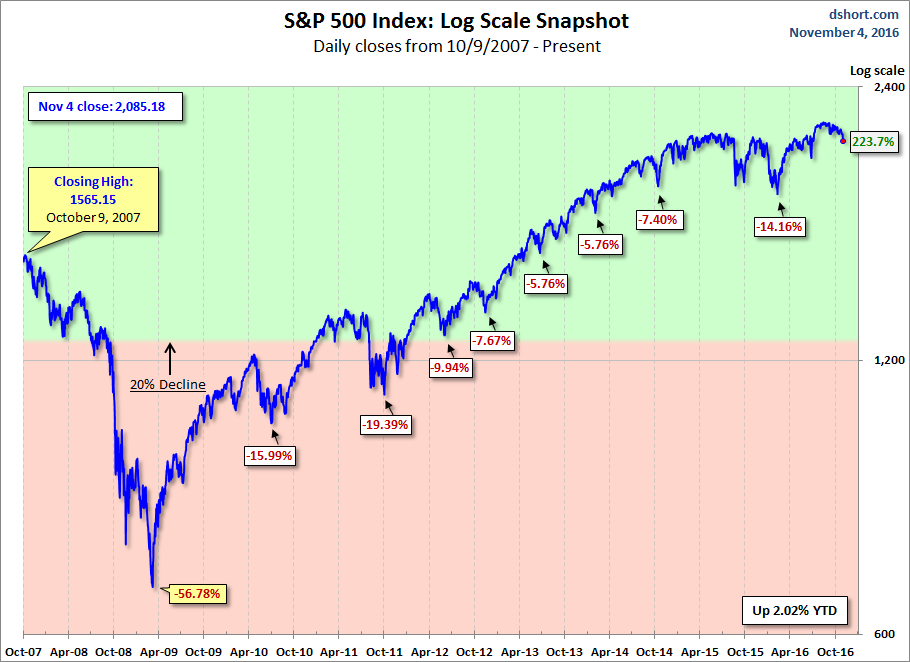
Here is a more conventional log-scale chart with drawdowns highlighted.
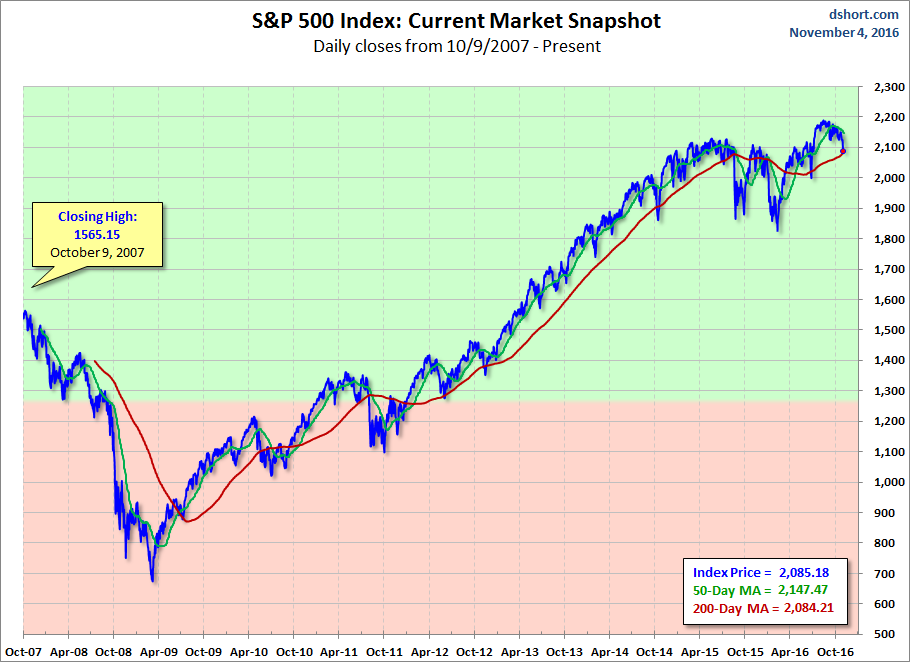
Here is a linear scale version of the same chart with the 50- and 200-day moving averages.
A Perspective on Volatility
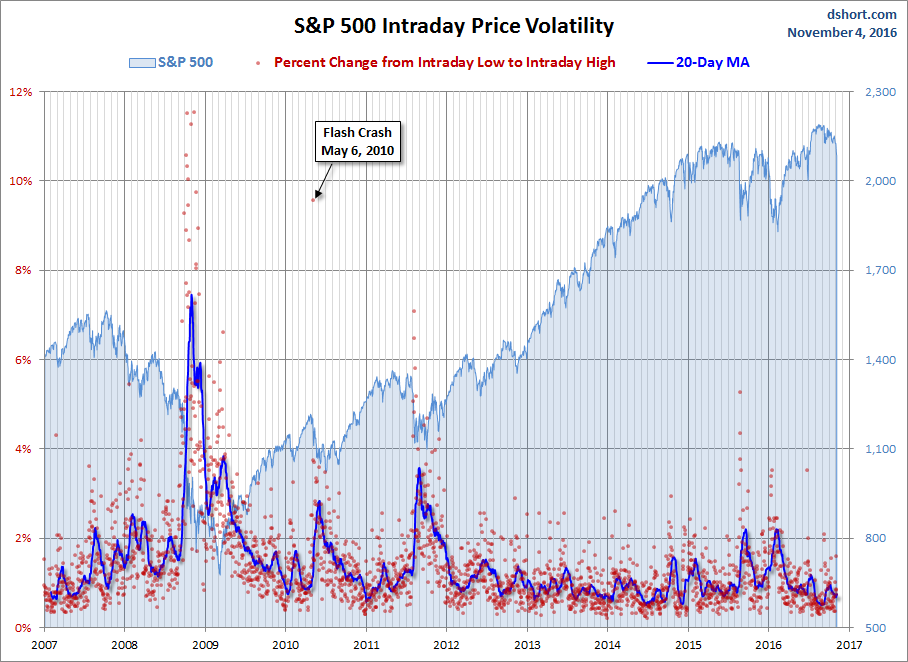
For a sense of the correlation between the closing price and intraday volatility, the chart below overlays the S&P 500 since 2007 with the intraday price range. We've also included a 20-day moving average to help identify trends in volatility.
