Economic news will be light this week until we get the first peek at January Retail Sales on Thursday. The S&P 500 opened in the red and traded in its second narrowest intra-day range of 2015, hitting its 0.03% high during the lunch hour and its -0.66% low early in the final hour. The index closed with a trimmed loss 0.42%.
The yield on the U.S.10-Year closed at 1.96%, up one bp from Friday's close.
Here is a 15-minute chart of the last five sessions.
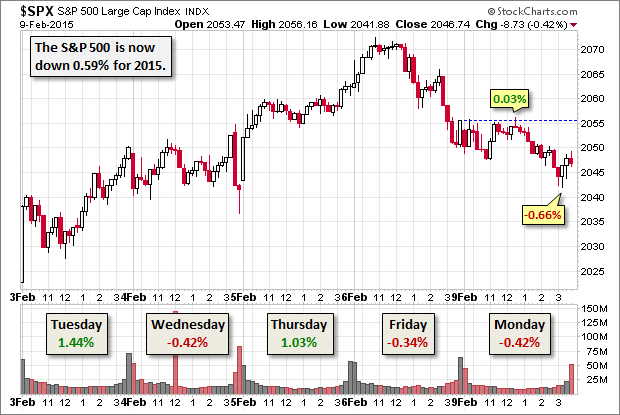
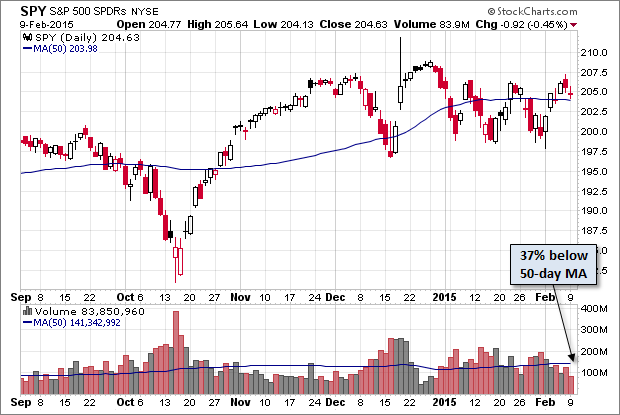
Here is a daily chart of the (ARCA:SPY) ETF, which gives a better sense of investor participation. Volume has been shrinking in February.
A Perspective on Drawdowns
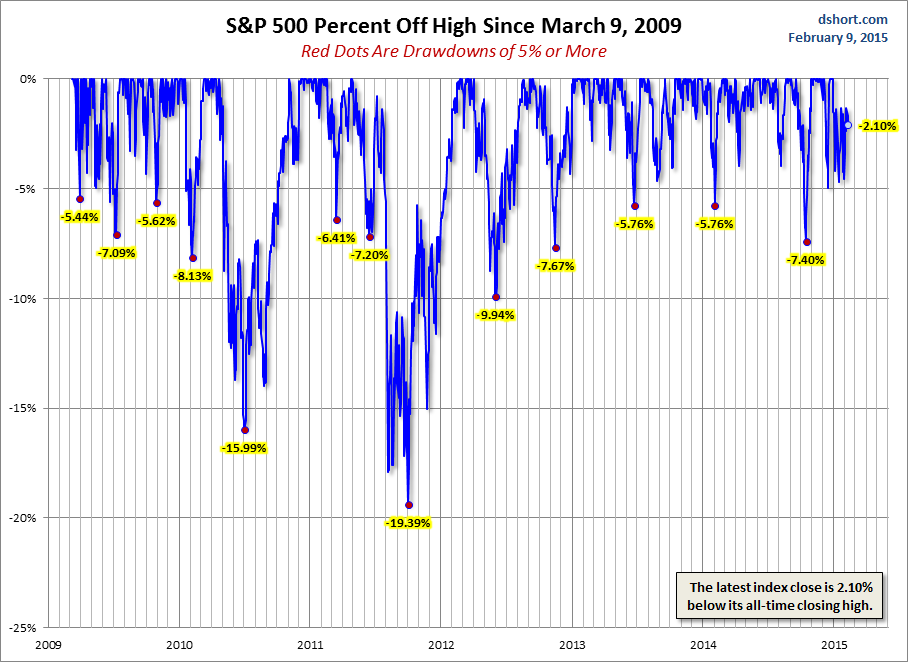
Here's a snapshot of sell-offs since the 2009 trough. The S&P 500 is 2.10% off its record close on December 29th.
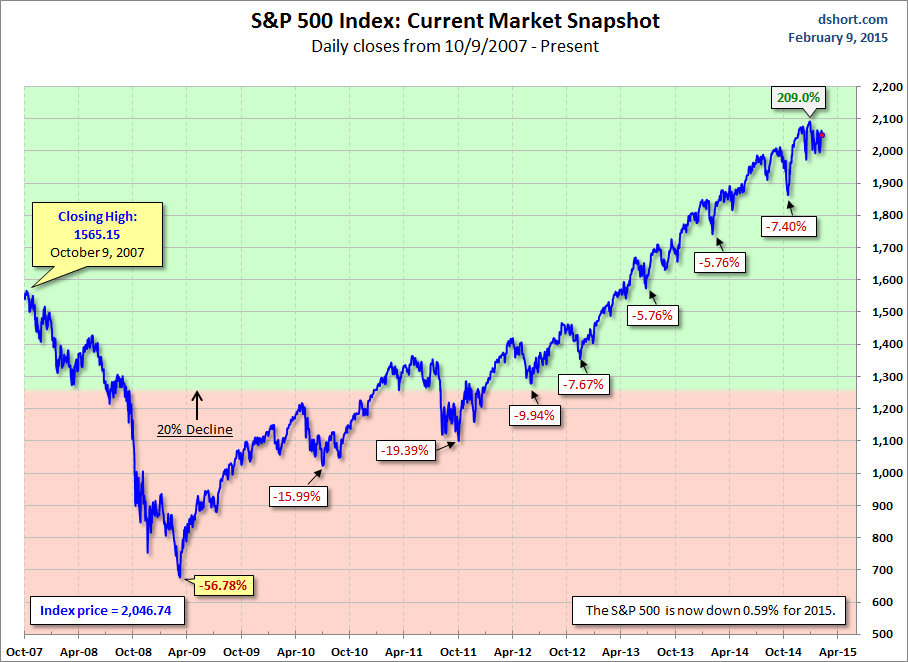
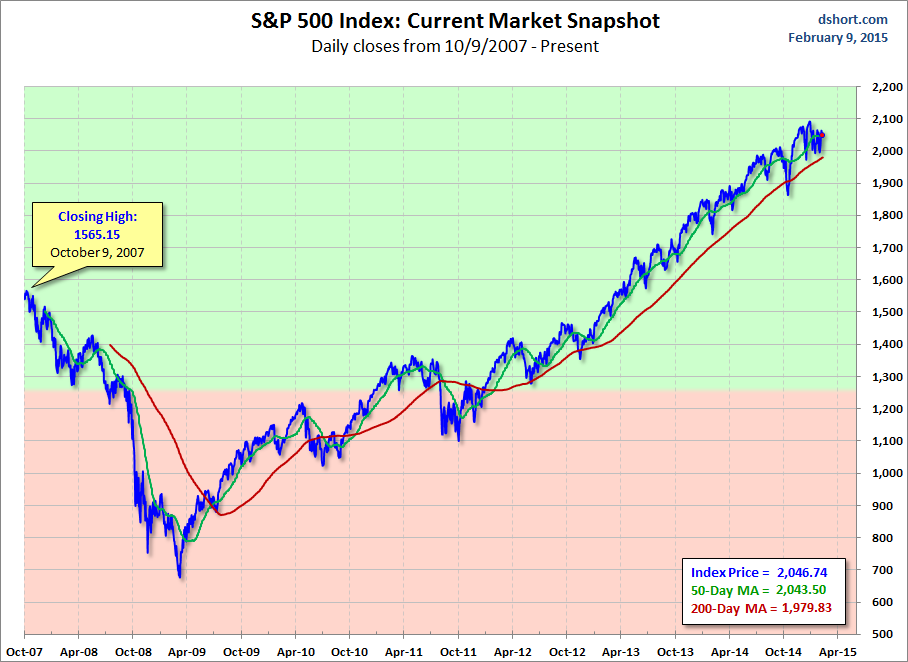
For a longer-term perspective, here is a pair of charts based on daily closes starting with the all-time high prior to the Great Recession.

