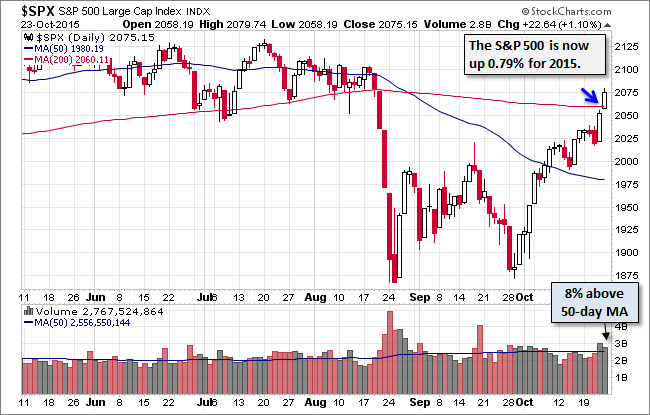
The rate cut announced by the Chinese central bank and some strong Tech earnings triggered an acceleration in the recent market rally. For the second day in a row, the S&P 500 surged at the open on Friday. It then gave back about half its gains before rising to its 1.33% mid-afternoon intraday high. A bit of profit-taking trimmed the closing gain to 1.10%. That was enough to put the index back in the green year-to-date (after 45 sessions in the red). The 500 is now up 0.79% from its 2014 close.
The yield on the 10-Year note closed at 2.09%, up 5 bps from the previous close.
Here is a snapshot of past five sessions.
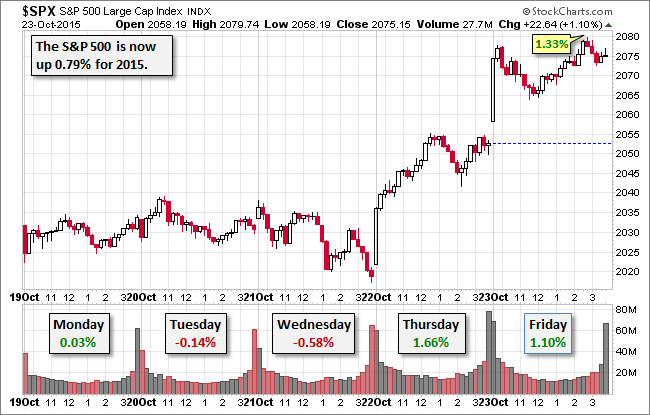
Volume was a bit above its 50-day moving average. The most conspicuous feature in the daily chart is that the S&P 500 is now back above its 200-day price moving average.
A Perspective on Drawdowns
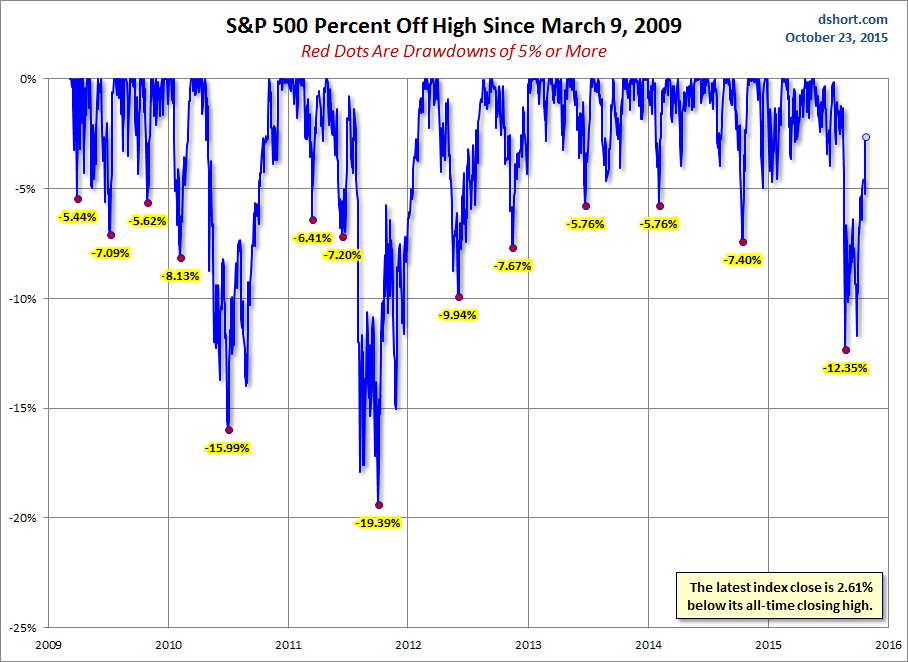
Here's a snapshot of selloffs since the 2009 trough.
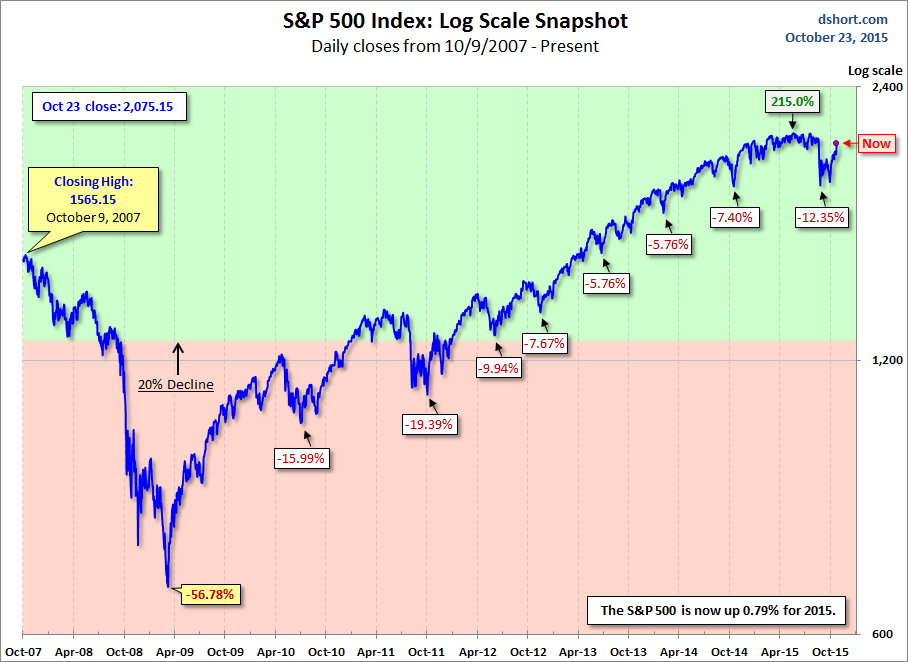
For a longer-term perspective, here is a log-scale chart base on daily closes since the all-time high prior to the Great Recession.
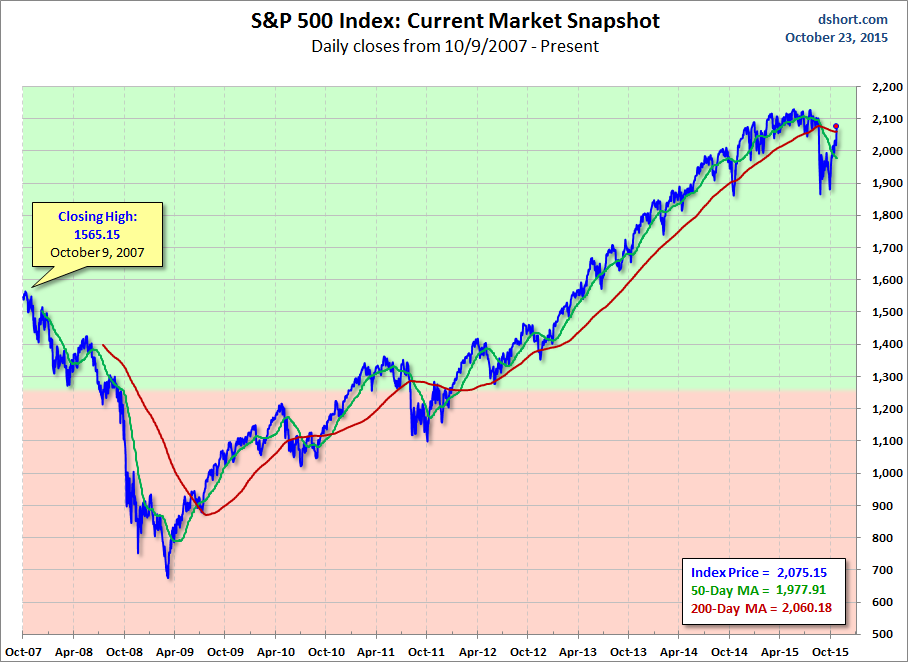
Here is the same chart with the 50- and 200-day moving averages. The 50 crossed below the 200 on August 28th.

