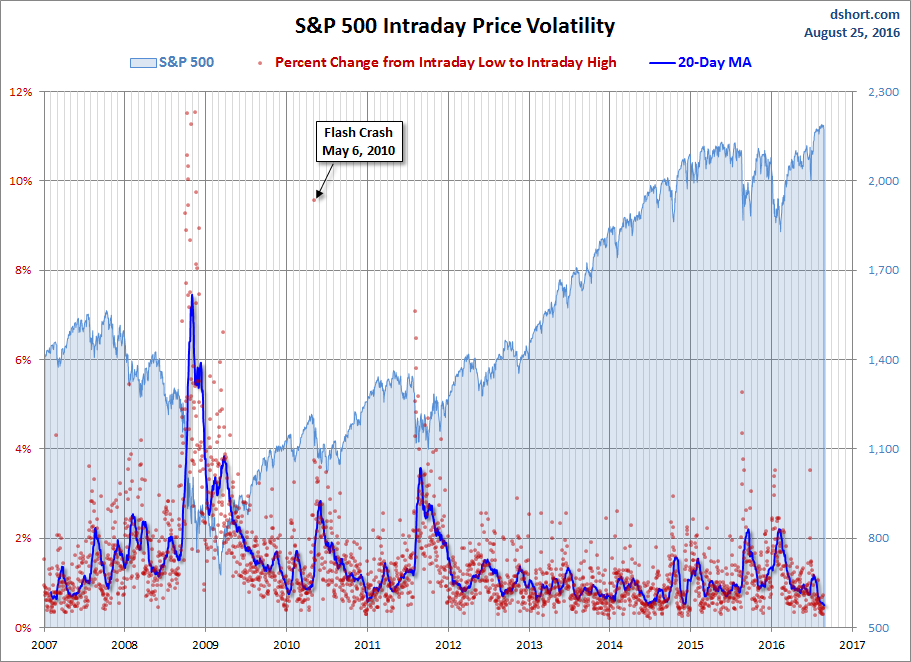
Equity markets around the globe posted losses on Thursday, rather minor ones in the US. Our benchmark S&P 500 spent the day in a narrow range between its 0.16% late morning high to its -0.26% intraday low at the beginning of the final hour of trading.
It trimmed about half the loss to close at -0.14% for the day. Thursday's trading range was at the 9th percentile of the 164 market day so far in 2016. Volume was on the light side in advance of the final day of the Jackson Hole event, with Fed Chair Yellen in the spotlight Friday morning.
The yield on the 10-year note closed at at 1.58%, up two basis points from the previous close.
Here is a snapshot of past five sessions in the S&P 500.
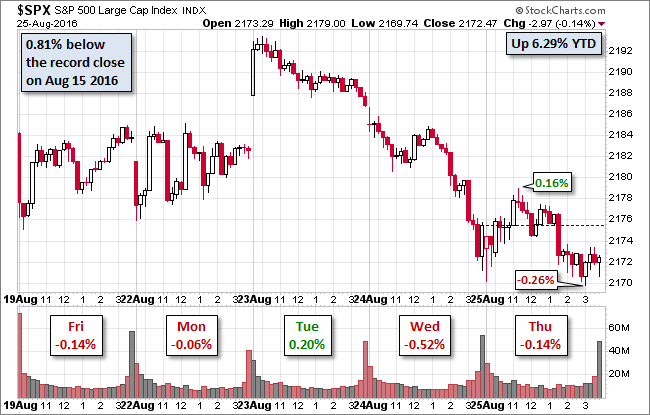
Here is daily chart of index. We see the narrow trading range in the second half of July followed by another narrow range, slightly higher, after the first week of August. Will Jackson Hole Friday send the index in a distinct direction? Stay tuned!
A Perspective on Drawdowns
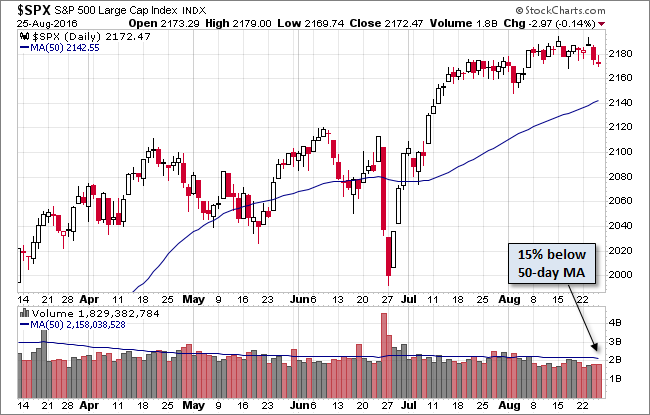
Here's a snapshot of selloffs since the 2009 trough.
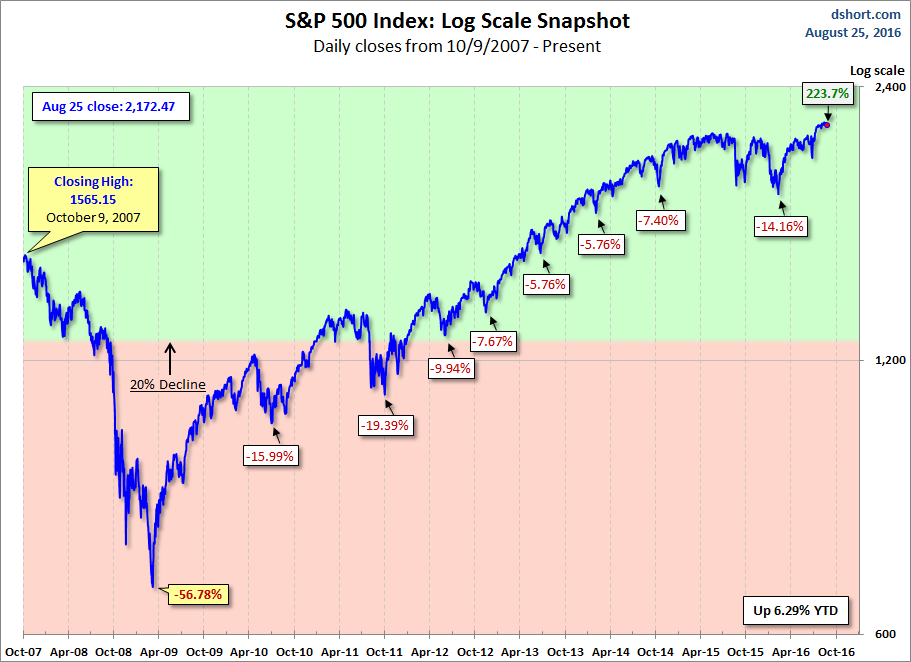
Here is a more conventional log-scale chart with drawdowns highlighted.
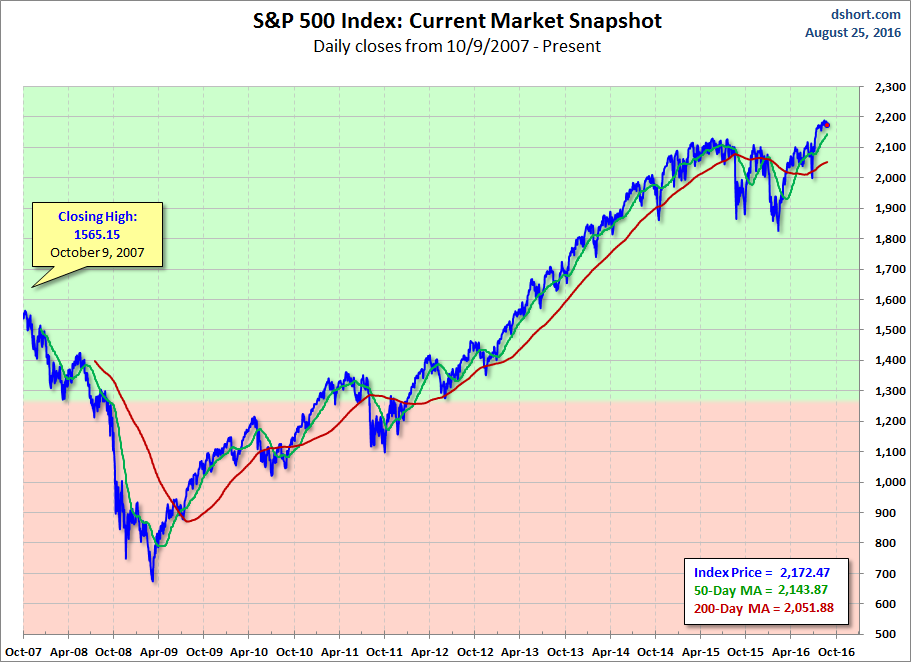
Here is a linear scale version of the same chart with the 50- and 200-day moving averages.
A Perspective on Volatility
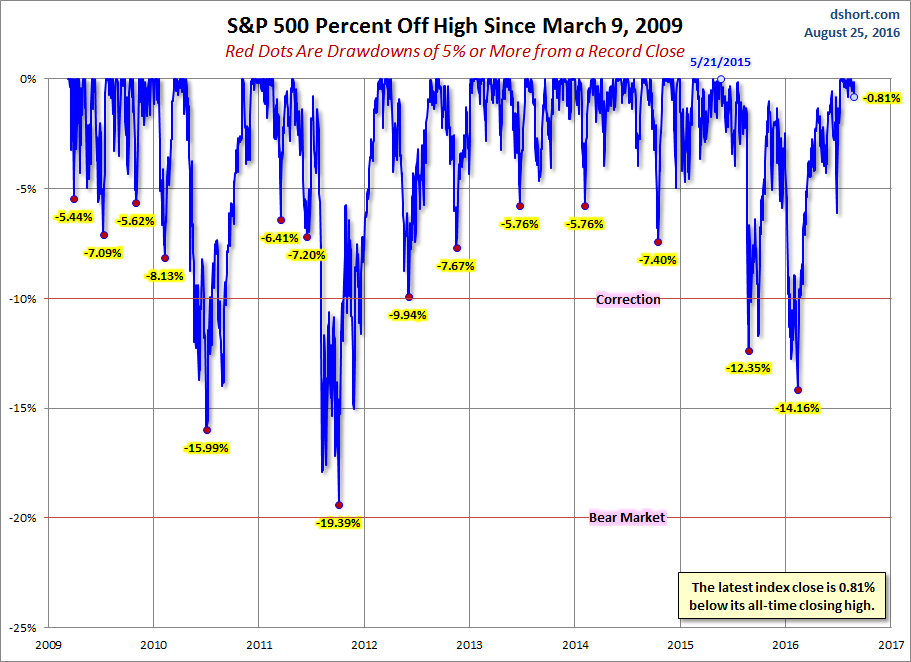
For a sense of the correlation between the closing price and intraday volatility, the chart below overlays the S&P 500 since 2007 with the intraday price range. We've also included a 20-day moving average to help identify trends in volatility.
