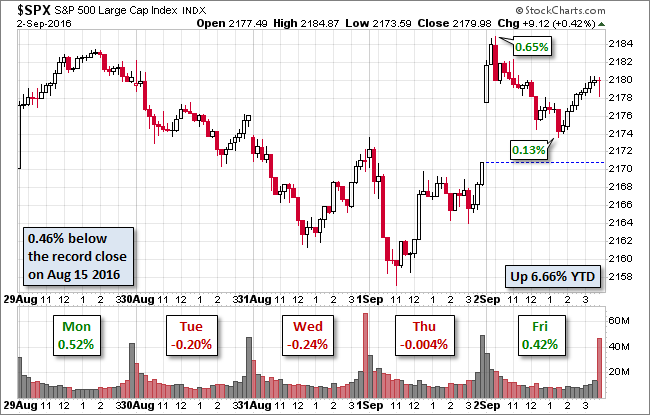
Pre-open futures were in the red prior to Friday morning's jobs report, but the disappointing number of new nonfarm jobs, 151K versus a consensus around 180K, instantly sent futures higher. The "bad news is good news" syndrome once again reaffirms the market's primary dependence on Fed pampering via low rates. The S&P 500 index hit its 0.65% intraday high about 30 minutes into the session. Profit taking sent the index to its 0.13% intraday low in the early afternoon. But the buying returned, and the 500 ended the session with a 0.42% gain.
The yield on the US 10 Year T-Note closed at at 1.60%, up three basis points from the previous close.
Here is a snapshot of past five sessions in the S&P 500.
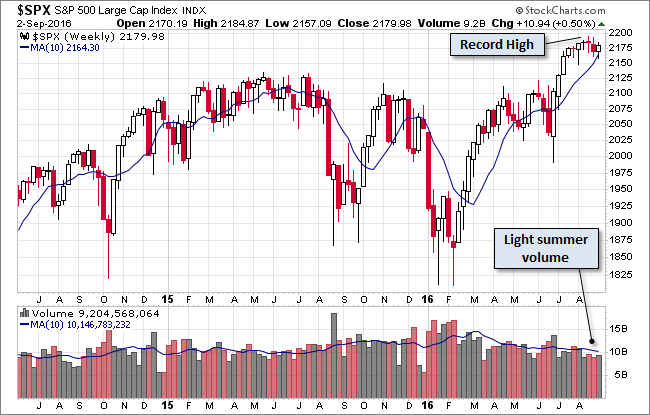
Here is weekly chart of the index, which snapped a two-week losing streak with a 0.50% gain. Friday's trading volume was 17% below its 50-day moving average, wrapping up a month of light market participation.
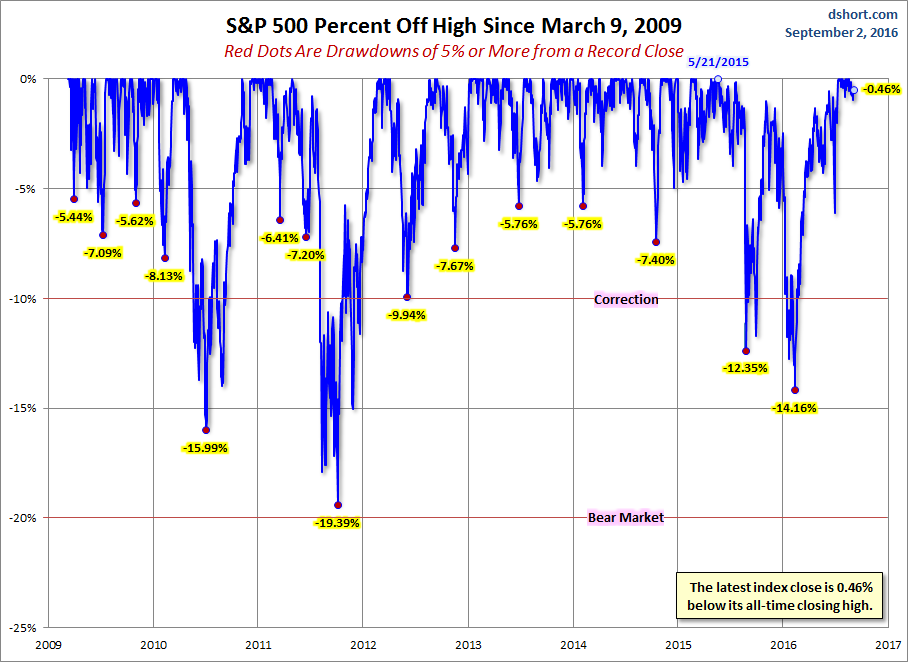
A Perspective on Drawdowns
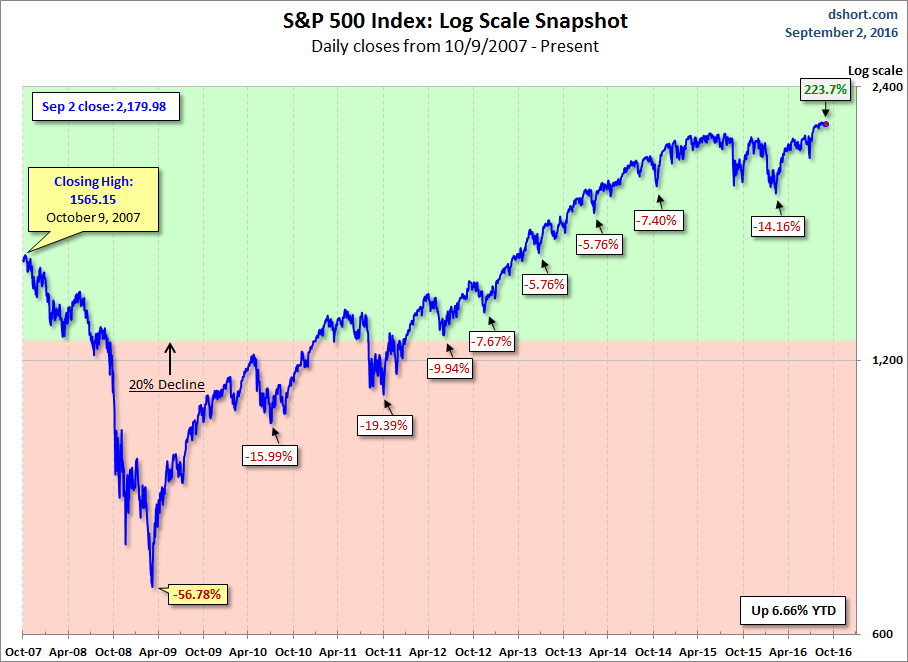
Here's a snapshot of selloffs since the 2009 trough.
Here is a more conventional log-scale chart with drawdowns highlighted.
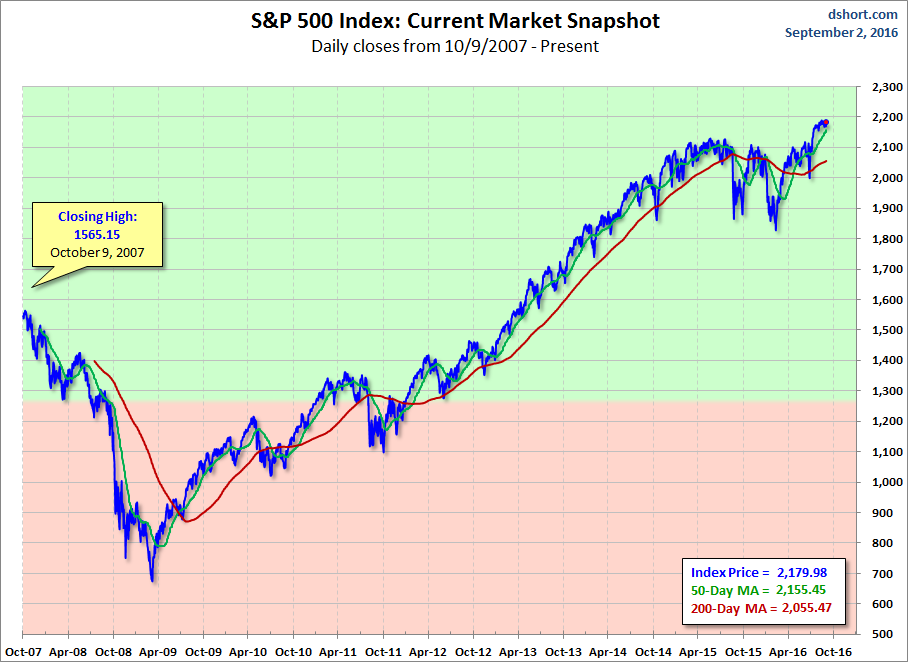
Here is a linear scale version of the same chart with the 50- and 200-day moving averages.
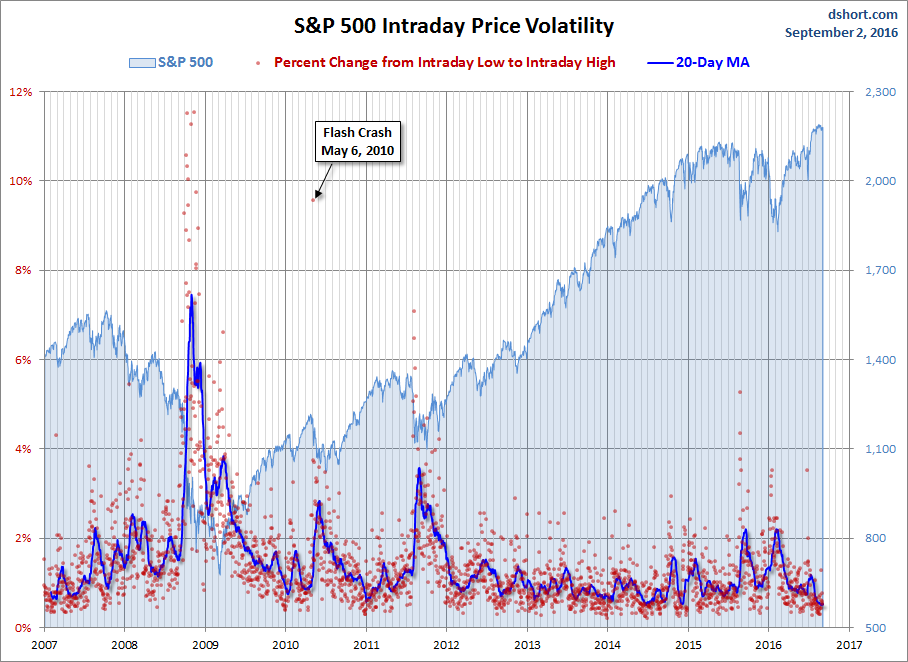
A Perspective on Volatility
For a sense of the correlation between the closing price and intraday volatility, the chart below overlays the S&P 500 since 2007 with the intraday price range. We've also included a 20-day moving average to help identify trends in volatility.
