Who is Kevin Hassett? Wolfe looks at the Trump ally tipped to become Fed Chair.
Note from Doug: I'm vacationing on the Rhone river cruise for the next several days and will be a bit intermittent in my routine updates. Fortunately my talented colleague at Advisor Perspectives, Jill Mislinski, will cover the economic indicators. But yesterday's market drama has briefly pulled me out of vacation mode.
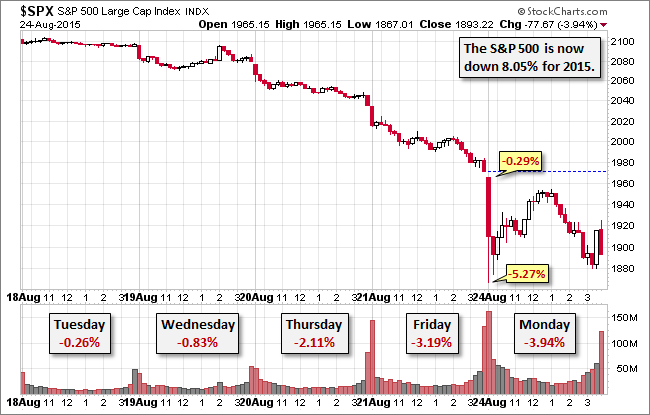
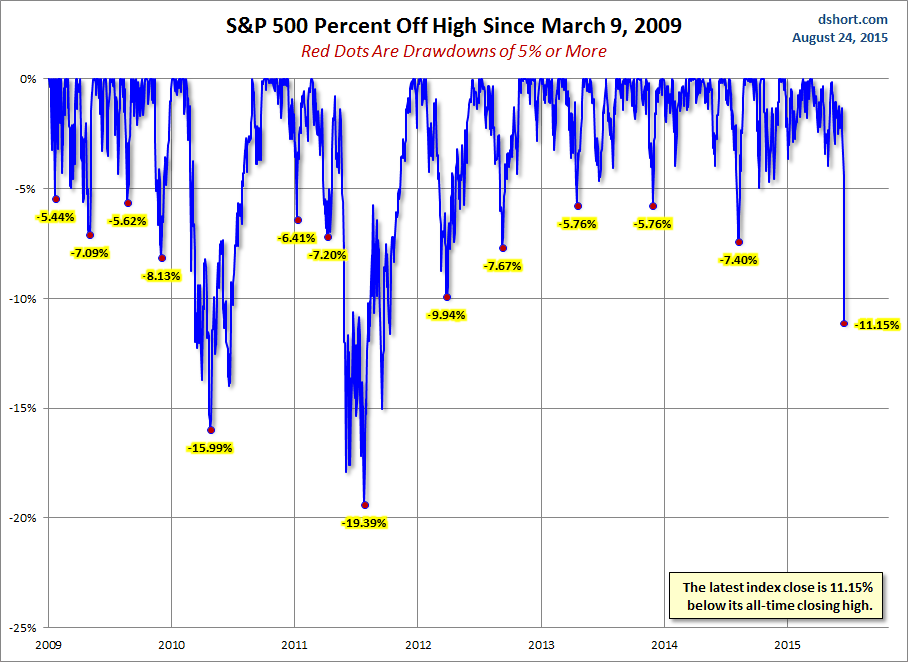
Last week's accelerating four-day selloff in the benchmark S&P 500 continued yesterday. The index opened fractionally lower and plummeted to its -5.27% intraday low a few minutes later. The index roller-coastered through the volatile session to its trimmed loss of -3.94%. The 500 is now down 8.05% for the year and 11.15% off its record close in May, which puts it in the conventional 10% decline "correction" territory.
It's interesting that the current selloff, the first correction since 2011, should happen on the virtual doorstep of the Fed's annual Jackson Hole ritual, especially in light of the widespread view that Fed intervention was the primary driver of the market levitation that triggered the selloff.
Will we see a bounce today? Will the Fed once again rescue the equity markets? Stay tuned!
The yield on the 10-year note closed the day at 2.01%, down 4 bps from Friday's close.
Here is a snapshot of past five sessions:

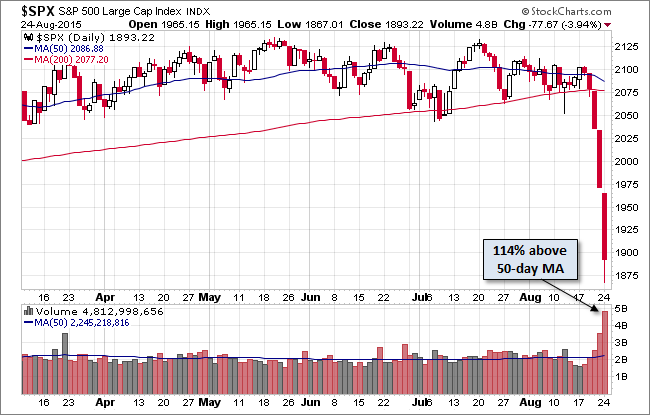
On a daily chart we see that volume has increased each day during this four-day selloff:

A Perspective on Drawdowns
Here's a snapshot of selloffs since the 2009 trough:

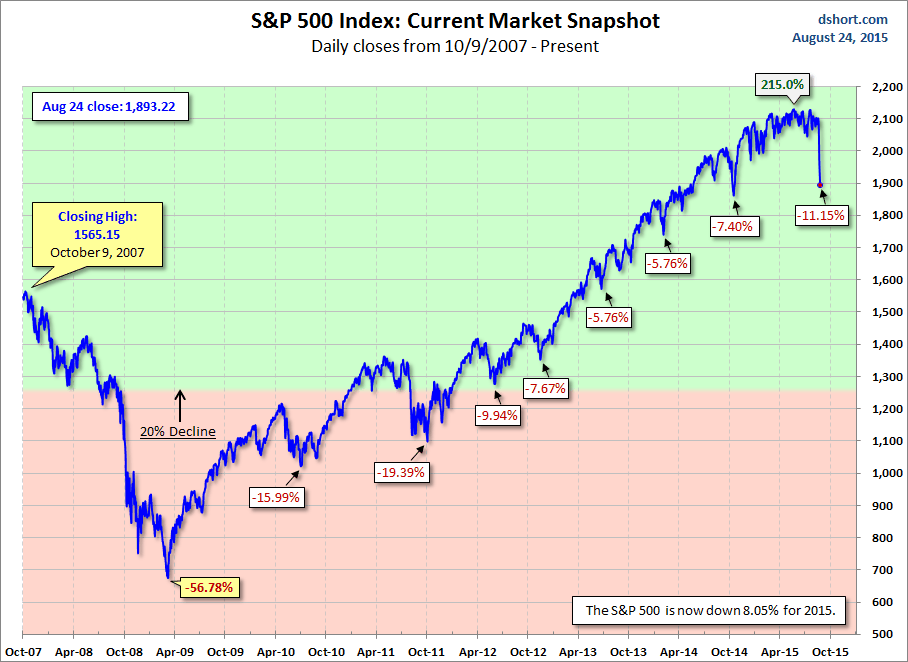
For a longer-term perspective, here is a chart based on daily closes since the all-time high prior to the Great Recession:

