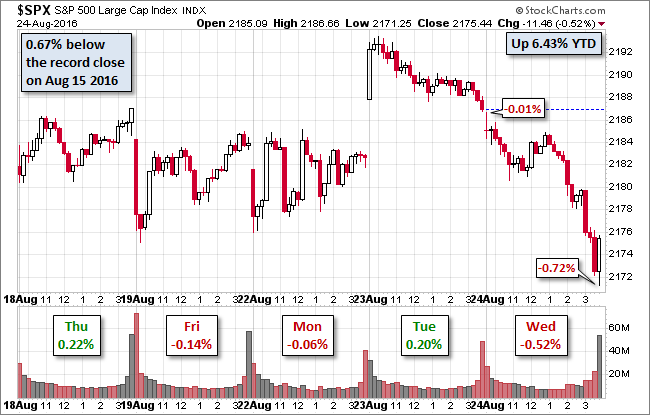
The S&P 500 opened lower in a continuation of the trend that started after Tuesday's intraday high in the early trade. A half-hearted reversal began late Wednesday morning but ended with the lunch hour.
The afternoon selling accelerated to the -0.72% intraday low shortly before the close. A bit of last-minute buying trimmed the loss to -0.52%.
Weakness in oil may have been a factor in Wednesday's market. End of day spot crude fell 2.77%.
Meanwhile, as we observed on Tuesday, the general view among the pundits is that equity markets are awaiting the Friday flavor of Fed Chair Yellen's speech at Jackson Hole (hawkish, dovish, or a confusing mix).
The yield on the 10-year note closed at at 1.56%, up one basis point from the previous close.
Here is a snapshot of past five sessions in the S&P 500.
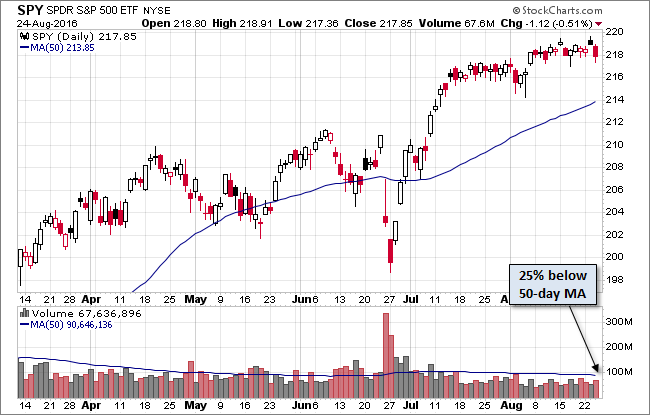
Here is daily chart of the SPDR S&P 500 (NYSE:SPY) ETF. Trading volume picked up a tad but remains in summer doldrums.
A Perspective on Drawdowns
Here's a snapshot of selloffs since the 2009 trough.
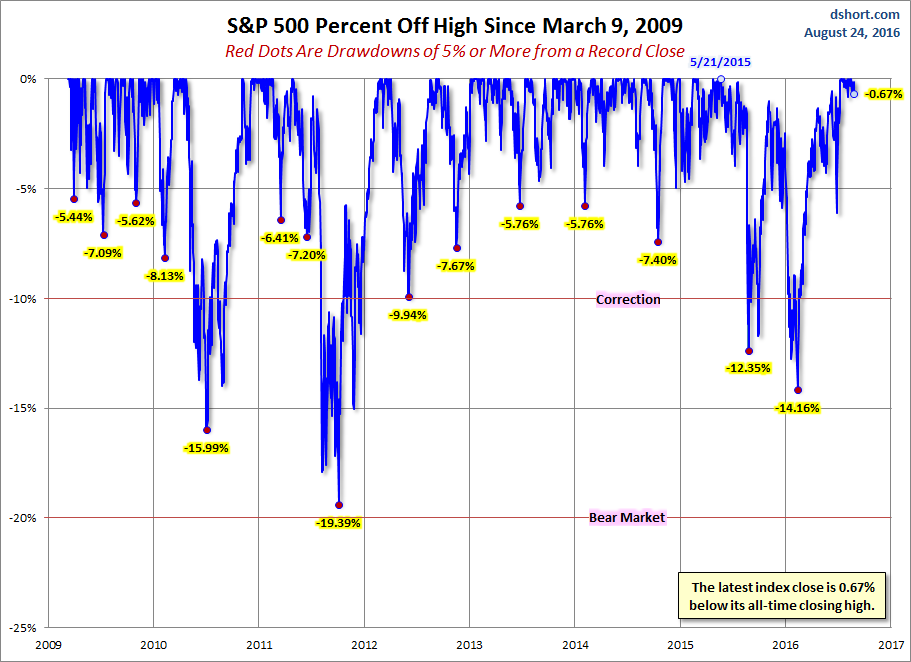
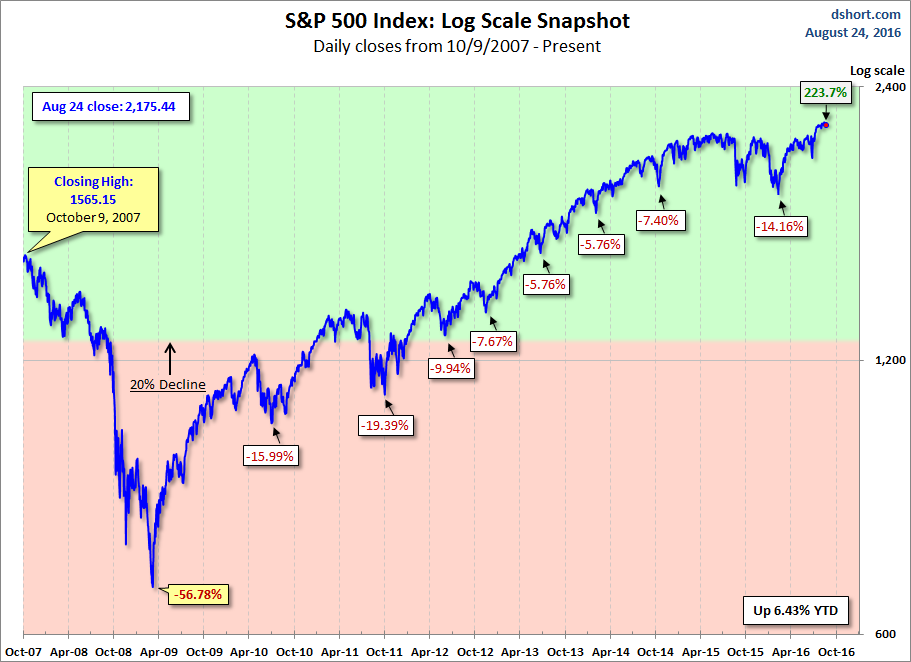
Here is a more conventional log-scale chart with drawdowns highlighted.
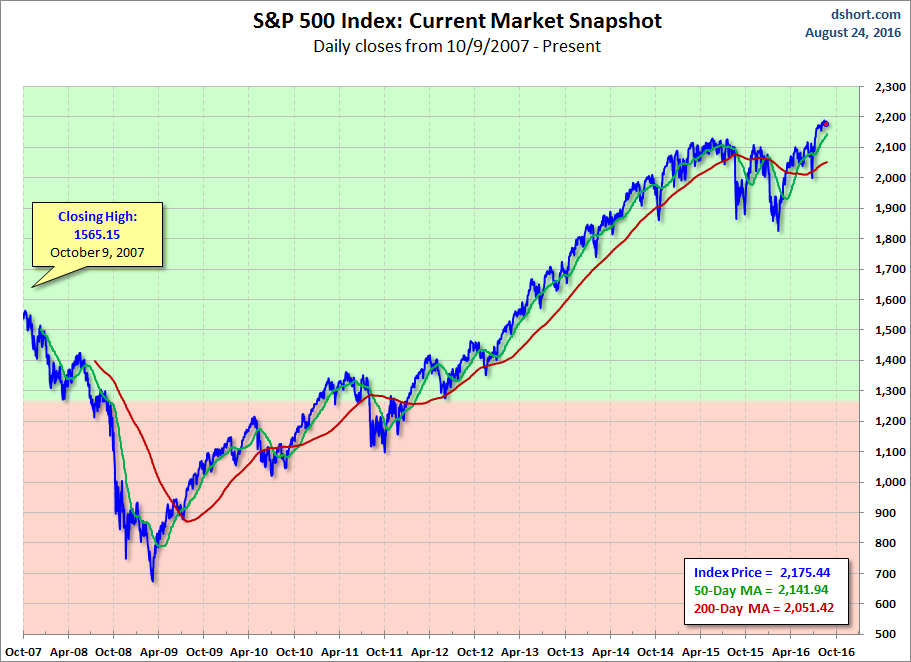
Here is a linear scale version of the same chart with the 50- and 200-day moving averages.
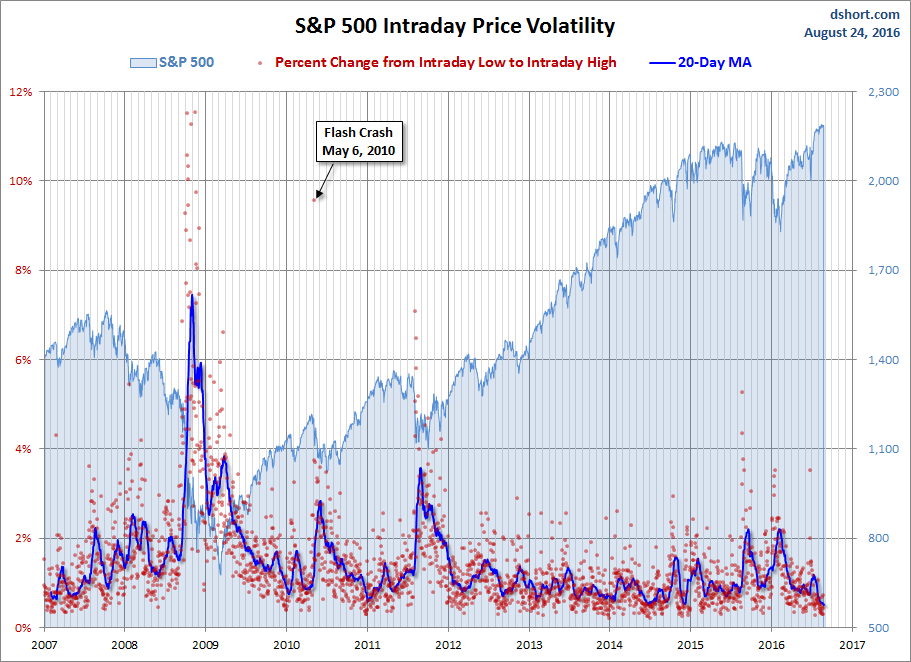
A Perspective on Volatility
For a sense of the correlation between the closing price and intraday volatility, the chart below overlays the S&P 500 since 2007 with the intraday price range. We've also included a 20-day moving average to help identify trends in volatility.
