Why the U.S. dollar still reigns supreme

I just spoke to the ‘Pit Bull’ Marty Schwartz. I know there are a lot of good traders out there that consistently make money, but there are few that have the tenacity and profitability of the ‘Bull’.
When I met him he was in his late 40’s and I was in my early 30’s. I was a wild kid from the floor that liked to fight, and after we got to know each other better, we built a friendship that was based on working hard, being there and ‘never giving up’. A lot has changed since my days on the trading floor. It was never easy trying to trade the futures markets, but the electronic trading revolution of high frequency and algorithmic trading are constantly evolving, and that is making it even hard for the small guy to exist.
The 90 / 90 / 90 Rule
Last week I had Raj Mahal, the former head of prop trading at B of A during the credit crisis, as a guest presenter for the MrTopStep Bootcamp. His market perspective is both colorful and enlightening. I asked him what the most S&P eminis he ever had on was? I thought it was 40,000 to 60,000, and he came back smiling saying sometimes they would have over 100,000 futures positions on. He went on to say that a day when the book was up or down $1 or 2 million dollars was considered flat. He also said the desk had many $30 and $40 million dollar days. Raj also said something I have never heard; its called the 90 / 90 / 90 / rule. What is it? 90% of retail loses 90% of their trading money in their first 90 days.
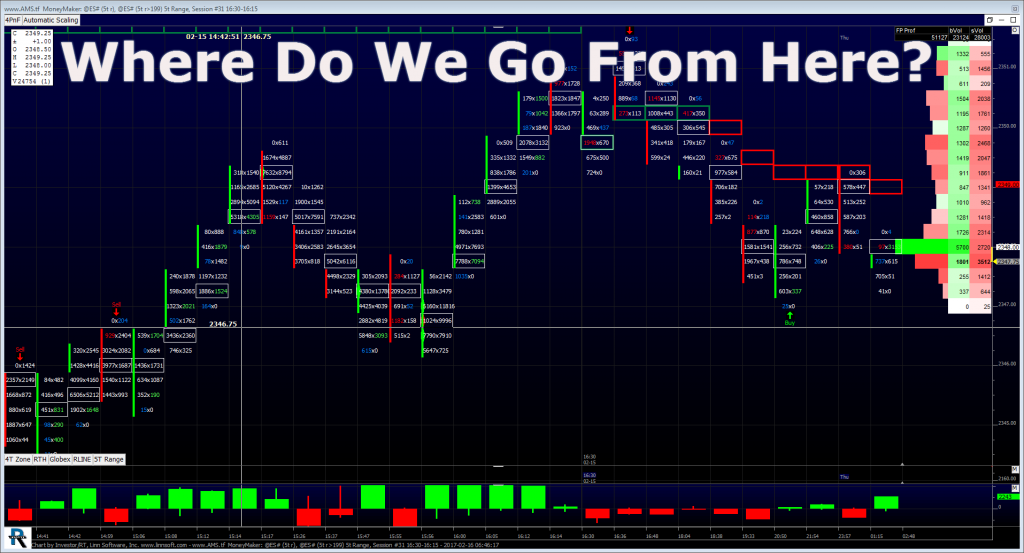
#2350
Yesterday was more of the same, no real low to buy. As I said in the our view section of yesterday’s article, the easiest trade is not so easy, but it works. The trade is to buy the open, walk away, and come back to see new all time highs. The ESH17 opened 3 handles lower at 2332.75, made a 2332.00 low, and never looked back. The futures rallied up to 2343.00 going into Euro close, sold off 6 handles, and then rallied up to 2351.00 before finishing the day up 15 handles.
While You Were Sleeping
Overnight equity markets in Asia were mixed, but with a lower tone. Europe opened up trading lower as the S&P 500 futures traded in a narrow globex range between the 2350.75 high made on the overnight open and the low of 2345.75 made a couple hours into the European session. This accounted for a 5 handle range with volume of 103k, and is now trading near the middle of that range as of 5:52 am cst.
In Asia, 6 out of 11 markets closed lower (Nikkei-0.47%), and in Europe 9 out of 11 markets are trading lower this morning (DAX -0.38%). Today’s economic calendar includes the Weekly Bill Settlement, Housing Starts, Jobless Claims, Philadelphia Fed Business Outlook Survey, Bloomberg Consumer Comfort Index, EIA Natural Gas Report, a 4-Week Bill Announcement, a 3-Month Bill Announcement, a 6-Month Bill Announcement, a 2-Yr FRN Note Announcement, a 2-Yr Note Announcement, a 5-Yr Note Announcement, a 7-Yr Note Announcement, a 30-Yr TIPS Auction, Fed Balance Sheet, and Money Supply.
Today’s Calendar Preview
BofA Merrill:
Barclays:
Catalyst Funds’ Hedged Futures Strategy Fund (HFXAX) Blowing Up The S&P And It Self
Our View: There was a little pull back overnight, with ‘little’ being the key word. The story I broke about the Catalyst Funds’ Hedged Futures Strategy Fund (HFXAX) blowing up in the S&P options was right on, and is now finally being picked up on by the mainstream media. Yesterday ‘Tyler Durden’ from @ZeroHedge finally caught on, and so did a few other outlets (Read the article here).
What I think is funny is that in Tyler’s story he said ‘he called a few trading desks.’ Ha! No, Tyler, you saw my tweets showing you the name of the company! What trading desks? It’s being executed on the CME floor in the S&P options, and surely he doesn’t know the broker who is clearing it, and even if he did (1 in a million), they would not tell him anything anyways.
Tyler, you can write all you want about this trade, but the bottom line is one thing and one thing only, it’s called an option collar. When the S&P moves above the short options strike price it causes the collar; meaning the fund gets shorter and sells as the (ESH17:CME) moves up. I don’t know where the position is now because he bought 15,000 in the money calls. Another chart I have shows ‘someone’ buying the ES in 400 lots. On Tuesday, the 400 lot buy bought over 20,000 ESH17s, and the same thing was showing up yesterday. Some say it’s been going on for over a week to 10 days.
Yesterday was the largest $VIX move on an SPX up day since Apr 2004, anyone doubting this story should have their head checked. I have said many times that we have not seen anything like this since the 1999-2000 tech bubble, and we all know how that ended.
Our view is for more of the same…You can sell the early to midday rally, if it sets up, and buy weakness…or just buy weakness.
As always, please use protective buy and sell stops when trading futures and options.


