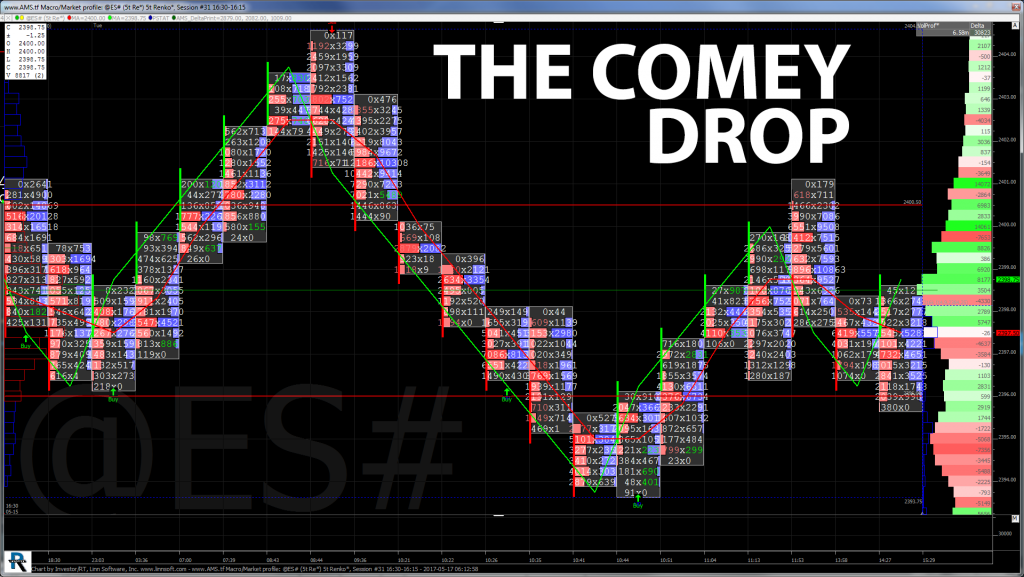
We will not be doing all the little ups and downs today. We laid out what was taking place in Tuesday’s Opening Print. The first part of it is all the low volumes, and what we call a ‘thin to win’ environment. The second part is all the ‘back and fill’ the ES has been doing. The third part came last Thursday when the S&P thin to win met the PitBulls trading rule about looking for a low the Thursday or Friday the week before the option expiration. I know this may sound like a lot of hocus pocus, but it’s not. While knowing how to read charts is a critical part of trading, so is recognizing the patterns that exist.
Crashes & More Crashes
While some stock market historians will say there were similar times when the stock market has rallied like it is today, I fully disagree. I was not around during the 1929 stock market crash, or the 1973-74 crash, but I was around for the 1987 crash, and every crash since. I was there for Black Monday, the Friday the 13th mini-crash, the 1990 recession caused by Iraq when they invaded Kuwait causing a sharp leap in oil prices and an 18% drop in the Dow over three months, the 1991 Japanese asset bubble, the July 2, 1997 Asian financial crisis (Brian and I were in Thailand), the October 7, 1997 mini crash, the 1998 Russian financial crisis, the March 10th 2000 Tech Bubble, the September 11, 2001 Attacks (The attacks themselves caused approximately $40 billion in insurance losses, making it one of the largest insured events ever), the February 7, 2007 Chinese asset bubble, the 2007-2008 US credit crisis, the November 9, 2009 Dubai credit crisis, the April 2009 European sovereign debt crisis, the may 6, 2010 FLASH CRASH, the August 18 to the 24th drop that wiped out all gains made in 2015, and last but not least, BREXIT.
A lot of people have been comparing the current rally to past drops, but I don’t believe that any of these drops and pops can compare to what we are seeing today. Ultra low borrowing costs, stock buybacks, and a ‘nowhere else to go but stocks’ mentality keeps driving the markets higher, and I am not sure when this will end. S&P 2450? 2500.00? 2600.00? Very few people thought the S&P would be trading at 2400, but it is, and while headlines like last night may rattle the markets, I just don’t think it’s enough to deliver the real knock out punch the bears are looking for.
While You Were Sleeping

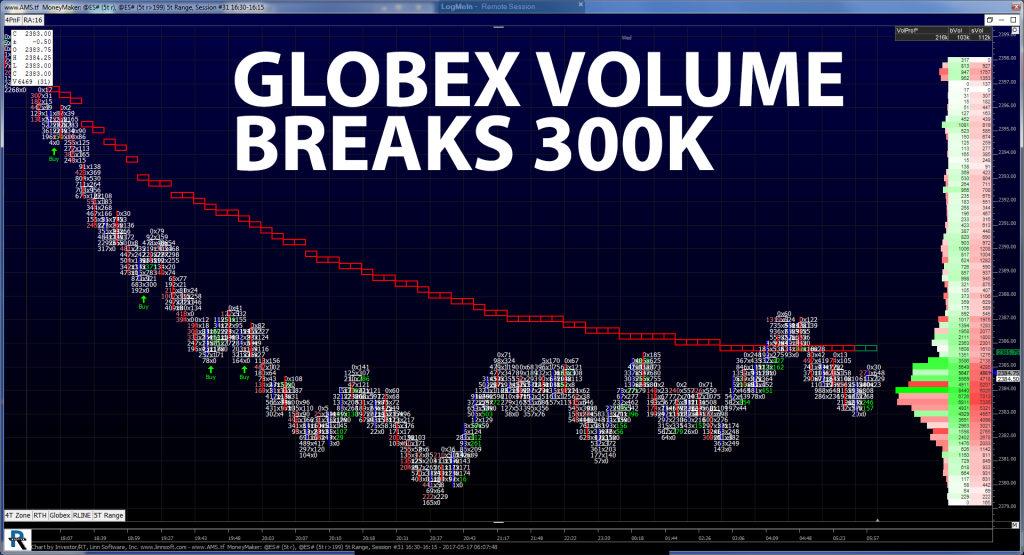
Just after Tuesday’s close came media reports regarding how former FBI Comey’s memo from his meetings with Trump implicated that the president may have been attempting to stop the investigation in the Flynn matter. On the globex open the futures printed 2396.50, traded one tick higher, and then sold off quickly down to 2379.25 in the first hour of the Tokyo session, down 17.75 points. From there the S&P’s have traded sideways, pushing up to 2387.25 early in the European session. As of 7:20 am cst the most recent print is 2383.00 down 14.00 handles on volume of 288k. Equity markets around the world saw a risk off move as all Asian majors closed lower, and currently every European market is in the red.
In Asia, 9 out of 11 markets closed lower (Nikkei -0.53%), and in Europe 12 out of 12 markets are trading lower this morning (DAX -0.41%). Today’s economic calendar includes MBA Mortgage Applications and the EIA Petroleum Status Report.
The James Comey Drop
Our View: What can derail the current rally? A North Korean nuke? A war in the Middle East? A U.S. economic downturn? Fired former head of the FBI James Comey notes saying President Trump asking him to drop the investigation of Michael Flynn? I am sorry my friends, but none of the above. The PitBull called me last night as said “are you watching this? The ES is down 14 off the Comey headlines,” and you know what I said to the PitBull? Don’t worry about it!
It’s 6:30 am and the ES that made a low at 2379.25 is now trading 2388.50. I do not want to say the ES can’t or won’t sell off hard, but I just don’t think the ES is going to get ‘killed’ or ‘reverse hard’. I am also not saying there won’t be a retest of the overnight low, but this will probably end up like all the other news events; drop and pop. The ES stopped exactly at a key support level.
Lets see the memo that Comey wrote. It was only a few days ago that the new acting director of the FBI said that the White House was not hampering the FBI’s investigations. There are a lot of holes in the N.Y. Times story. Our view is that we didn’t think the ES could go up all week. We thought it would be firm in the first part of the week, and weak later in the week. My guy says you can sell the early rallies and buy weakness, but I can’t rule of some more ‘drops & pops’.
PitBull: CLM osc 22/-16 turns down on a close below 47.61, ESM osc 3/15 turns down on a close below 2387.98, VIX osc 2/-14 turns down on a close below 1000.

As always, please use protective buy and sell stops when trading futures and options.

