You know what they say, time flies when you’re having fun! For the stock market that fun started back on November 8th when billionaire Donald Trump won the presidency of the United States. Backed by solid economic growth, and rather than looking to the past healthcare bill reform failure, the markets are starting to get a forward look to them. Moving forward with his tax cutting initiatives and infrastructure projects the S&P has moved higher 3 out of the last 4 trading days, taking back over 49 handles of a 83 handle loss from the 2401.00 high. The long term March end of the quarter stats won over the short term statistics, but I think the ES got a kicker, Mondays 2318 globex healthcare hangover.
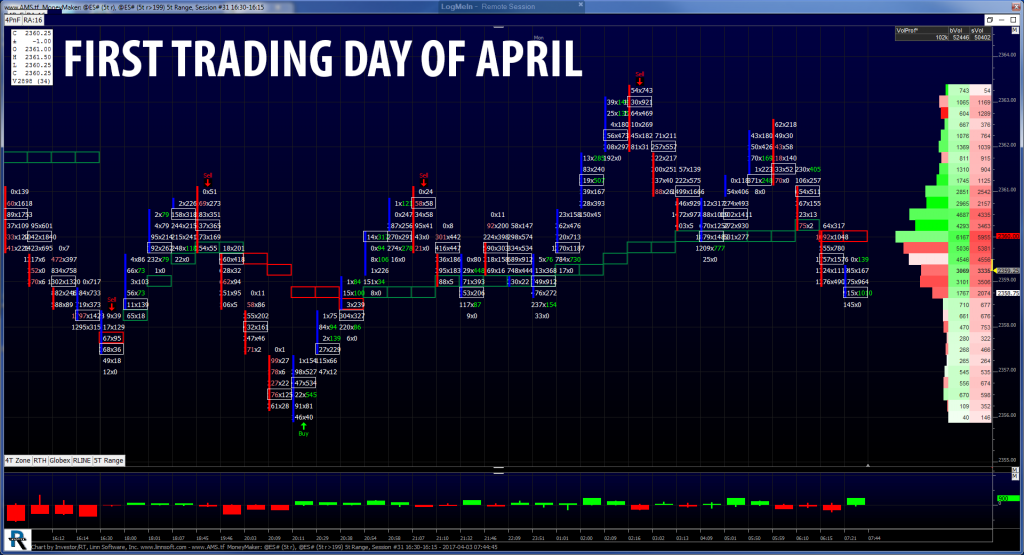
As the week continued the futures kept pressing higher into the quarter end as portfolio managers saw equity value with the S&P retracing nearly 4% from it’s all time intraday high. The S&P’s were able to build a floor back above 2350 and start to target higher prices. On Friday’s trade the ESM17:CME opened at 2360.50, and made an early 2358.50 low on the open, then began to slowly grind higher up to 2366.75 just after 12:30 cst. The futures and found resistance at Thursday’s high, as the guys with the better seats showed up, and the MiM showed about $1 billion to sell early on.
From there the futures dipped down to 2359.50 just after 1:00 pm cst, then rallied back to 2366.25, making a lower high in the final hour. Some heavy sell orders pushed the S&P’s down to a new low of the day at 2357.75 before settling at 2358.75. The price action resembled Thursday’s; push the S&P’s above 2366 by midday and then sell into the close. It’s clear that the bears are trying to defend above 2365, meanwhile bulls have a floor at 2350 and 2356.
While You Were Sleeping
Overnight Asian stocks markets rallied as all open indices closed in the green, followed by Europe which is trading mostly higher this morning. The S&P 500 futures traded to a globex low of 2356.00 on the Tokyo open, down 3.25 handles, and then rallied to a session high of 2363.25 early after the Euro open, up 3.00 handles. As of 6:12 am cst the last print is 2359.25, unchanged on the day, with volume at 98k.
In Asia, 9 out of 9 open markets closed higher (Nikkei +0.39%), and in Europe 8 out of 11 markets are trading higher this morning (DAX +0.32%). This week’s economic calendar features Friday’s Employment Situation and 26 other reports, 4 Fed speakers and 11 US Treasury events. Today’s economic calendar includes the PMI Manufacturing Index, ISM Mfg Index, Construction Spending, William Dudley Speaks, a 4-Week Bill Announcement, a 3-Month Bill Auction, a 6-Month Bill Auction, Gallup US Consumer Spending Measure, and Jeffrey Lacker Speaks.
MrTopStep MiM / Walk Away Trader at 1:45 CT Gave Clues To How The ES Was Going To Close
Our View
The MrTopSep ‘walk away’ trade’ worked perfectly on Friday. The rule is that you are supposed to have scaled up offers in the ES from 11:30 CT to 1:00 and at exactly 12:30 the ES started going down. I have to admit the ‘walk away’ trade has not worked all that well as of late, but it sure worked well last Friday. When the MiM started showing over $1.7 billion to sell at 1:45 CT, I had a feeling the markets would get weak.
While not all the MrTopStep trading rules work as well as they used to, I still feel they all have merit. That said, today is the first trading day of April. Below I have provided all the historical stats for April. It looks like the ES could be firm in the beginning of the month and weak around tax time. Our view for today; it’s a tough call. My gut tells me Fridays late sell off may lead to some more selling, but I also know it’s the first trading day of the new quarter, and its Mutual Fund Monday. Look for a Globex low, retest and buy the early weakness. You then can sell the rallies or just wait and buy the pull backs.
Facts:
- First trading day of April, Dow up 17 of the last 22.
- April 1999 first month for the Dow to gain over 1,000 points.
- Income tax deadline, day after Easter, second worst post holiday, Monday before expiration, Dow down 18 of the last 28
- Since 1928, July has been the top-performing month.
- April is the third strongest month of the year
- April has been higher 62.9% of the time with only December higher more often.
- Since 1950*, April has been the third-best month for the Dow (1.9% average gain)
- Over the past 10 years April has been in the green nine times
- The only time April was in the red was in 2012 when it fell only 0.7%
- Income tax deadline, day after Easter, second worst post holiday, Monday before expiration, Dow down 18 of the last 28
- April prone to weakness after tax deadline
- April Expiration day, Dow up 14 of the last 20
PitBull: CLK osc 25/-19 turns down on a close below 4953, ESM osc 12/-6 turns down on a close below 234812, VIX osc -7/0 turns down on a close below 1119.

As always, please use protective buy and sell stops when trading futures and options.


