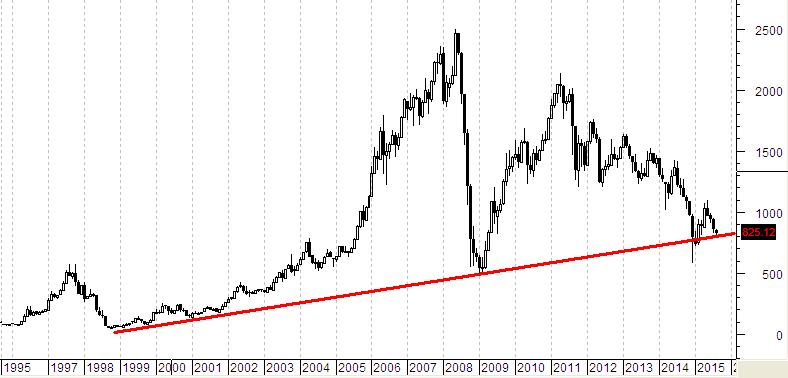
The RTSI had breached this 17 year long trend line in late 2014 but managed to bounce back above this line. Technical observations point out that if it falls below this line, it may fall to drastically low levels. The first target for RTSI is its previous low of last year at 578. And the next major level is at 265, which is the 161% Fibonacci retracement of the current rally of last one year. This is the level that RTSI was at in 2001! There are possibilities that it RTSI may fallback by 14 years from the current stage.
Even a fall to 578 would be a big blow with repercussions for whole world. Even if Russia is not having major part in global trade of major economies, there would be geopolitical impacts affecting everyone.
The fact that RTSI is still making lower lows and is yet to make a higher high since 2011, signifies that it is in clear downtrend without any visible indication of a reversal. Will it be able to recover? It needs to be watched closely.