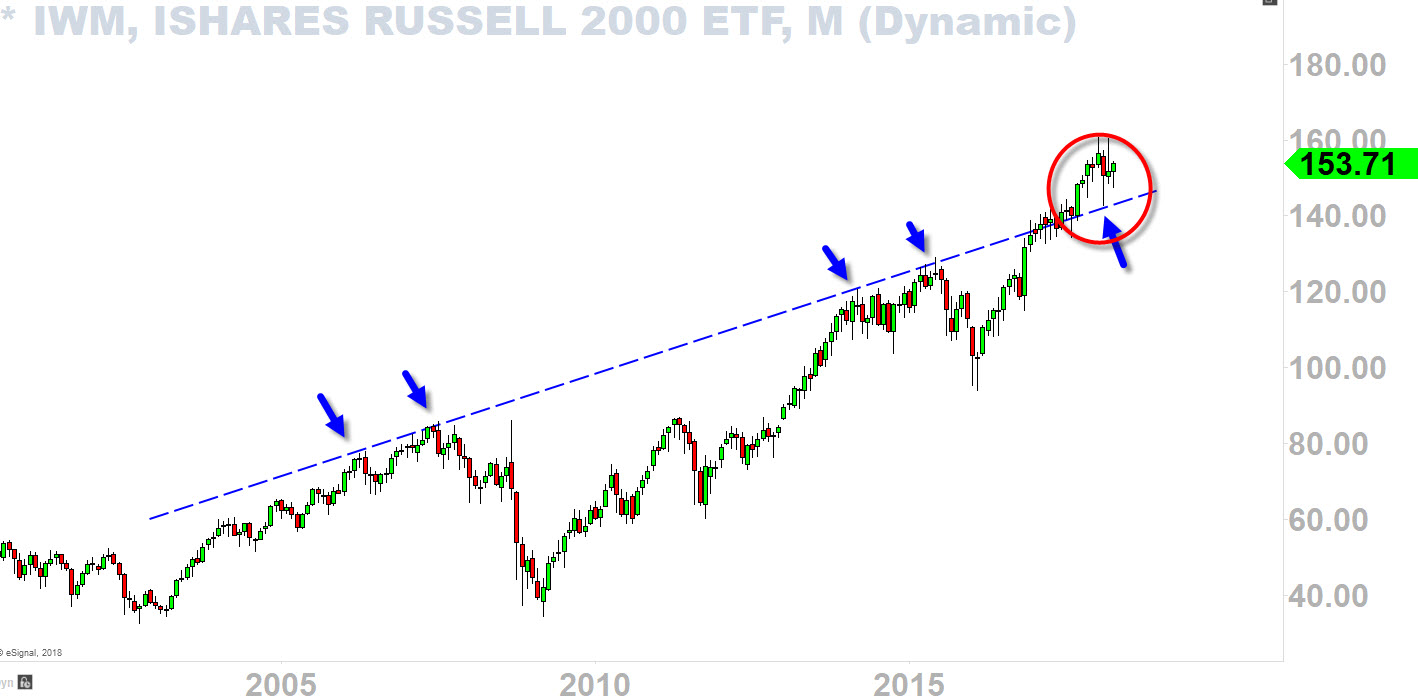
This is the same exact chart I've been watching since early 2017. This chart was one the main reasons of why I was ferociously accumulating iShares Russell 2000 (NYSE:IWM) calls in early 2017 before completely closing it out in Jan 2018.
Well, this is what I call a "rising pivot" (rising blue dotted line) because it was prior resistance now potentially acting as support in a rising uptrend. This setup works well in a strong bull market like we are in today if you can implement and incorporate well with your intermediate-term strategy. (The long-term chart could be the backbone of your strategy – 8/17/17 most traders were freaking out calling for the crash because it made a new low, but I was buying the dip – watch this video and see what happened back then).
Let's fast forward to 1st quarter of this year, as you can see that long lower wick in the chart below (right above the up-arrow) – it came down and tagged my "rising pivot" before rushing right back up (long lower wick printed). This is what I am saying, if you understand the long-term picture you can implement your strategy better in the intermediate to minor term while everyone on earth is screaming with fear.
So the possible scenario is that as long as the price holds above this rising pivot, I believe Small-Caps (Russell 2000) can lead the entire market this year and possibly next year. This is mainly because I still think small-caps are lagging compared to the Dow and S&P 500. In 2017 S&P 500 performed 25% while Russell 2000 performed 15%.
I think Small-Caps (Russell 2000) is in line preparing to make its run, and getting ready to lead the entire market.

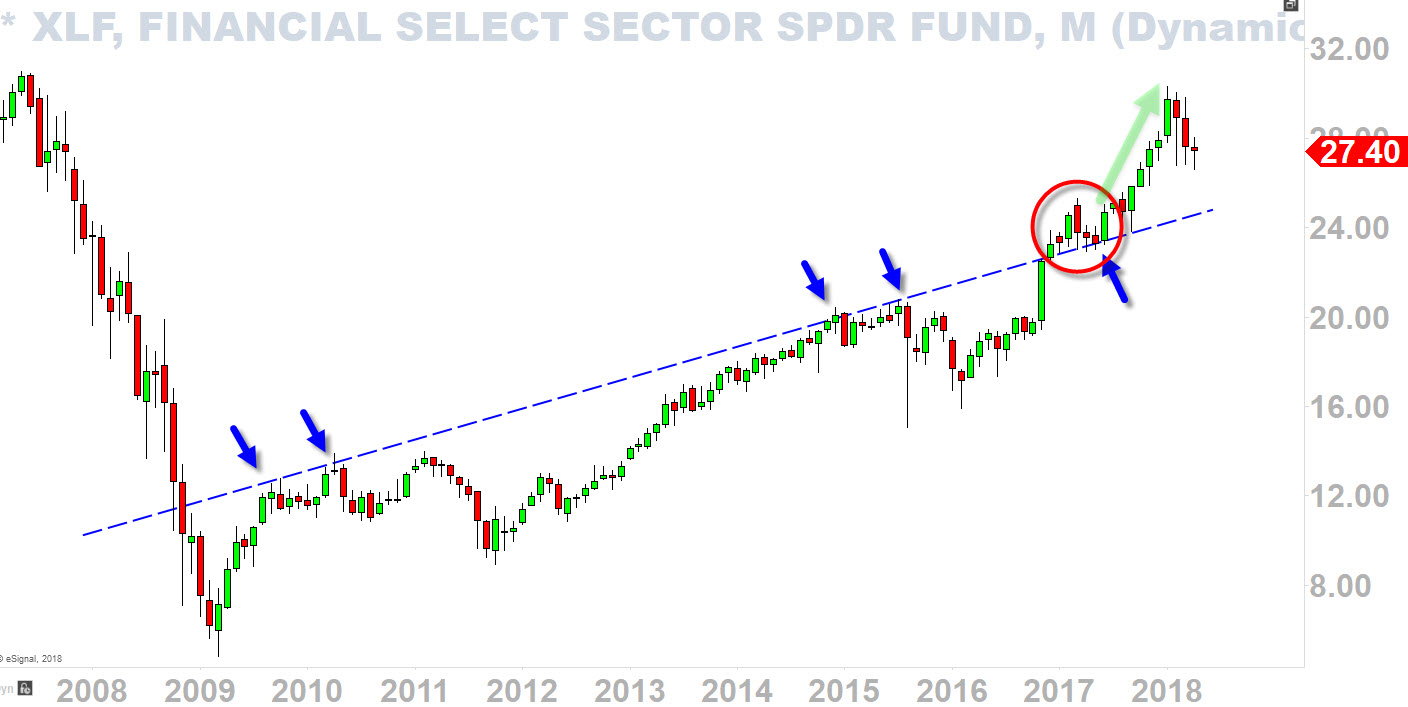
CASE 1: Financial Select Sector SPDR (NYSE:XLF)

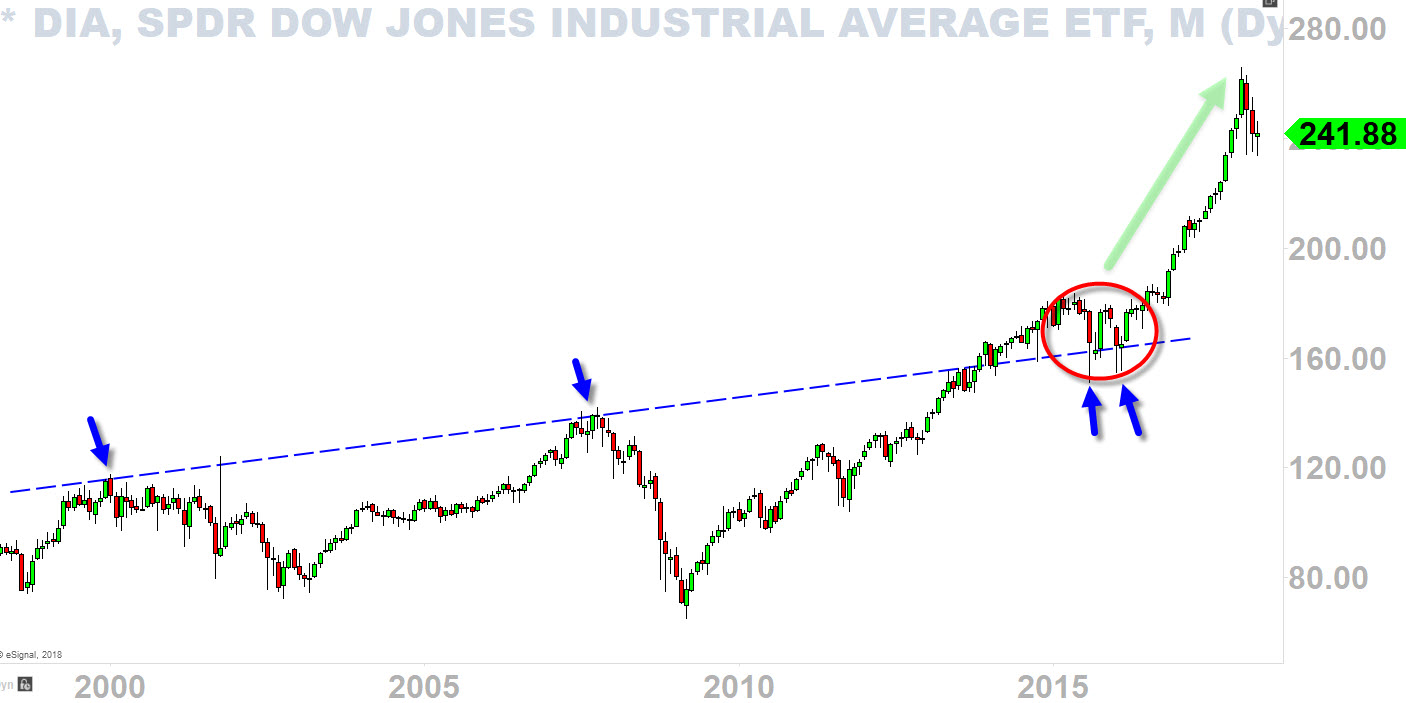
CASE 2: Dow Jones (DIA)

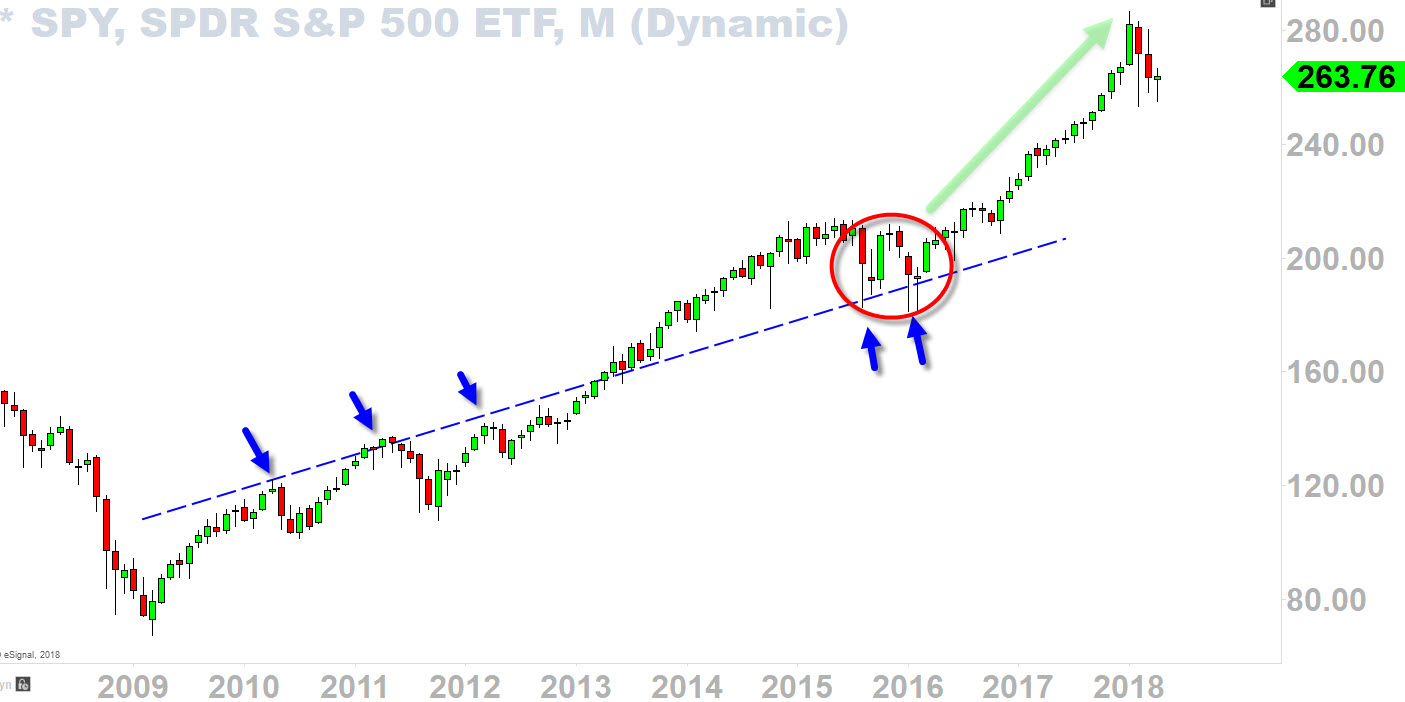
CASE 3: S&P 500 (SPY (NYSE:SPY))

