Investing.com’s stocks of the week
Today happens to be the 14th birthday of IWM (ARCA:IWM), (iShares Russell 2000 Index) the primary small cap ETF which tracks the Russell 2000. Since the IWM was born, the Russell 2000 has risen by 141% while the S&P 500 has only climbed by 37%. As a result, the Forward PE ratio of the Russell 2000 is significantly higher than the S&P 500, 18.2x compared to 15.8x.
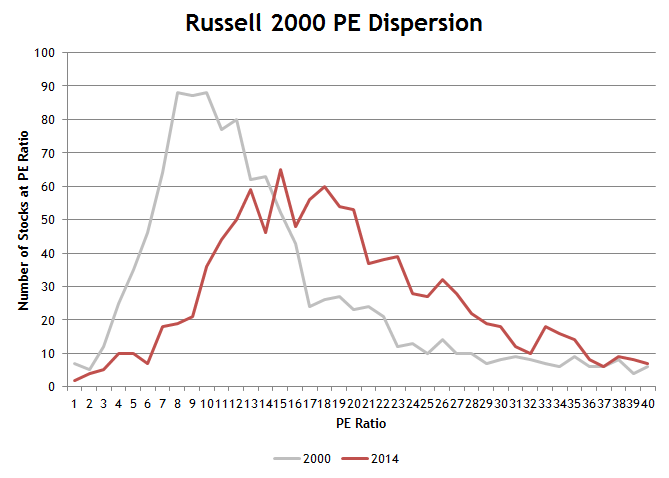
Below is a chart comparing the dispersion of PE ratios in the Russell 2000 on the day the IWM was born vs. today. I’ve seen the chart put together for the S&P 500 before, but had not seen it done for the Russell 2000. The S&P 500 chart shows that PE ratios are more clustered today than they have been in the past.
Partially because of the IWM, I initially expected that the Russell 2000 would also have more stocks clustered in a smaller range of PEs than in 2000. However, it actually looks like the Russell’s PE distribution has stretched over a broader (albeit more expensive) range than when the IWM first started trading. This is a little surprising because I would have thought that the small cap rally had pushed valuations closer together. ”Small cap” has been viewed as a singular asset class and money has systematically poured into the space over the last decade.
The wider dispersion is a little surprising, but it makes sense. There’s a lot more variance in quality among the Russell 2000′s constituents than the S&P 500′s. There are some great small companies, but there is also a lot of junk. Different quality companies should be priced differently.
The information in this blog post represents my own opinions and does not contain a recommendation for any particular security or investment. I or my affiliates may hold positions or other interests in securities mentioned in the Blog, please see my Disclaimer page for my full disclaimer.

