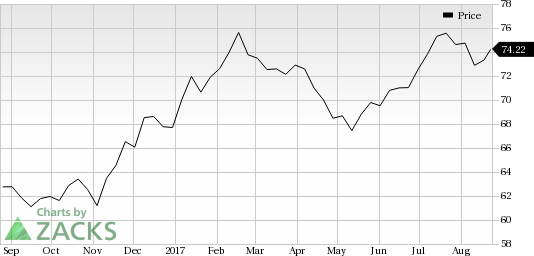
Royal Bank of Canada (NYSE:RY) reported third-quarter fiscal 2017 (ended Jul 31, 2017) net income of C$2.8 billion ($2.1 billion), down 3% from the prior-year quarter.
Lower non-interest income, along with escalating expenses and provisions, remained headwinds. However, elevated loans and deposits balances, and higher net interest income were on the positive side.
Revenues Down, Expenses & Provisions Flare Up
Total revenues came in at C$10 billion ($7.6 billion), down 2.9% on a year-over-year basis. Revenues were affected by lower non-interest income, partially offset by higher net interest income.
Net interest income came in at C$4.3 billion ($3.3 billion), up 4.9% from the prior-year quarter. Non-interest income was C$5.7 billion ($4.3 billion), down 6.6% year over year.
Non-interest expenses were C$5.4 billion ($4.1 billion), up 5.9% from the year-ago quarter. The rise came primarily due to an increase in almost all the components.
During the quarter, Personal & Commercial Banking, Wealth Management, Investor & Treasury Services and Canadian Banking segments’ net income reported year-over-year rise of 6%, 25%, 13% and 5%, respectively. However, Insurance segment’s net income reported a year-over-year slump of 56%. Excluding one-time items in the prior year, net income increased 25%. Notably, the Corporate Support segment reported net loss, and net income for Capital Markets segment declined 4% year over year.
As of Jul 31, 2017, Royal Bank of Canada’s total average loans and acceptances came in at C$547.7 billion ($440 billion), up 3.8% from the prior-year quarter. Additionally, deposits were C$778.6 billion ($625.5 billion), up 3.2% year over year. Total assets were C$1.2 trillion ($0.96 trillion), slightly up from the year-earlier quarter.
Total provision for credit losses was C$320 million ($242.5 million) in the quarter, up 6% year over year, mainly due to higher provisions in the Personal & Commercial Banking and Capital Markets divisions. However, provisions in Wealth Management decreased.
Strong Capital Position
As of Jul 31, 2017, Royal Bank of Canada’s Tier 1 capital ratio came in at 12.4%, up 30 basis points from the prior-year quarter. Total capital ratio came in at 14.4%, expanding 20 basis points year over year.
The company’s estimated Common Equity Tier 1 (CET1) ratio came in at 10.9%, advancing 40 basis points year over year.
Our Viewpoint
We believe a consistent improvement in loan balances and diversified product mix will drive Royal Bank of Canada’s organic growth. Though lower revenues, along with stringent regulatory reforms and escalating expenses, keep us skeptical about the company’s sustainable growth over the long term, the export-driven economy of Canada is anticipated to benefit from the gradual recovery of the U.S. economy, thereby benefiting the bank.
Royal Bank of Canada currently has a Zacks Rank #2 (Buy). You can see the complete list of today’s Zacks #1 Rank (Strong Buy) stocks here.
Performance of Other Foreign Banks
Deutsche Bank AG (NYSE:DB) reported net income of €466 million ($512.4 million) in second-quarter 2017, significantly up on a year-over-year basis. Income before income taxes more than doubled to €822 million ($903.9 million) on a year-over-year basis. Cost management and reduction in provisions were positive factors. However, lower revenues due to trading slump were an undermining factor. Notably, net new money inflows were recorded during the quarter.
UBS Group AG (NYSE:UBS) reported second-quarter 2017 pre-tax operating profit of CHF 1.68 billion ($1.71 billion) on an adjusted basis, up around 1% from the prior-year quarter. Results displayed increase in net interest income (up 22% year over year), along with net fee and commission income (up 5% year over year), partially offset by lower trading income (down 23% year over year). Notably, the quarter benefited from the company’s consistent focus on expense management.
Itau Unibanco Holding S.A. (NYSE:ITUB) posted recurring earnings of R$6.2 billion ($1.9 billion) in second-quarter 2017, up 10.7% year over year. Including non-recurring items, net income came in at R$6.0 billion ($1.87 billion), up 9.1% year over year. Results displayed a decrease in revenues and solid balance-sheet position. Higher expenses and lower managerial financial margin were headwinds.
One Simple Trading Idea
Since 1988, the Zacks system has more than doubled the S&P 500 with an average gain of +25% per year. With compounding, rebalancing, and exclusive of fees, it can turn thousands into millions of dollars.
This proven stock-picking system is grounded on a single big idea that can be fortune shaping and life changing. You can apply it to your portfolio starting today.
Learn more >>
UBS AG (UBS): Free Stock Analysis Report
Deutsche Bank AG (DB): Free Stock Analysis Report
Itau Unibanco Banco Holding SA (ITUB): Free Stock Analysis Report
Royal Bank Of Canada (RY): Free Stock Analysis Report
Original post
Zacks Investment Research

